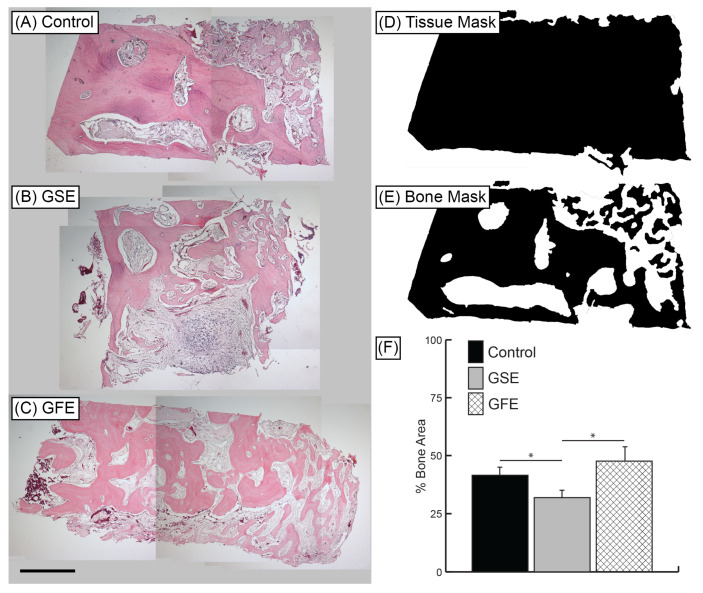
Figure 4.
Representative H&E samples at 40× magnification. (A) Control group, (B) GSE treatment, and (C) GFE treatment. Scale bar indicates 1 mm. Histomorphometric analysis: Whole tissue masks (D) and bone area masks (E) were generated using Adobe® Photoshop® software. Bone area and tissue area were calculated using ImageJ software. (F) Average percent bone area. GSE treatment led to significantly reduced bone area compared to control and GFE groups. Statistically significant results indicated by * (p < 0.05). Bars are SDs.

