Fig. 3.
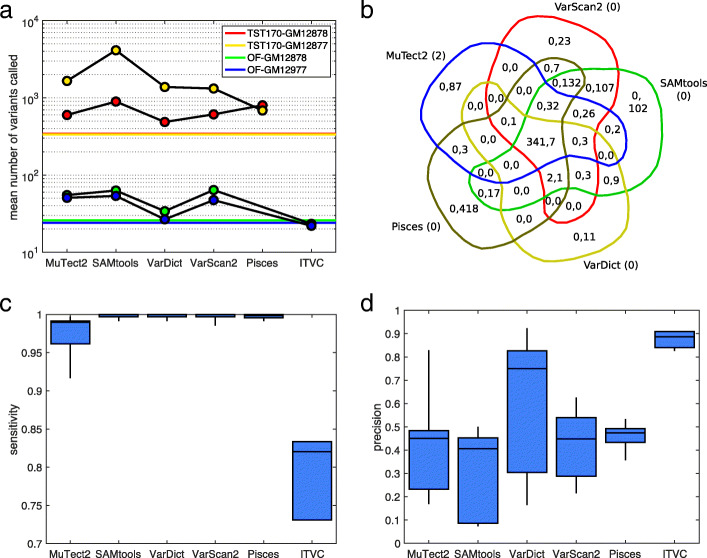
Summary of variant calling across all 18 datasets, when using a consistent set of calling parameters. a Numbers of SNVs called by different variant callers, averaged across replicates within our four conditions: GM12878 or GM12877 cells, sequenced using TST170/Illumina or OF/IonTorrent. Colored horizontal lines indicate the number of gold standard mutations that ideally would be detected. b Venn diagram of calling results for five callers on replicate one of the TST170–GM12878 data. Within each region, the two numbers give the number of true positive (TP) and false positive (FP) calls agreed upon by the relevant algorithms. The numbers in parentheses next to each algorithm’s name are the number of false negatives (FN) by that algorithm. c,d Sensitivity (TP/TP+FN) and precision (TP/TP+FP) for each algorithm across all the datasets to which it was applied. The box-and-whisker plots show the percentiles: 0% (i.e. minimum), 25%, 50% (i.e. median), 75%, and 100% (i.e. maximum)

