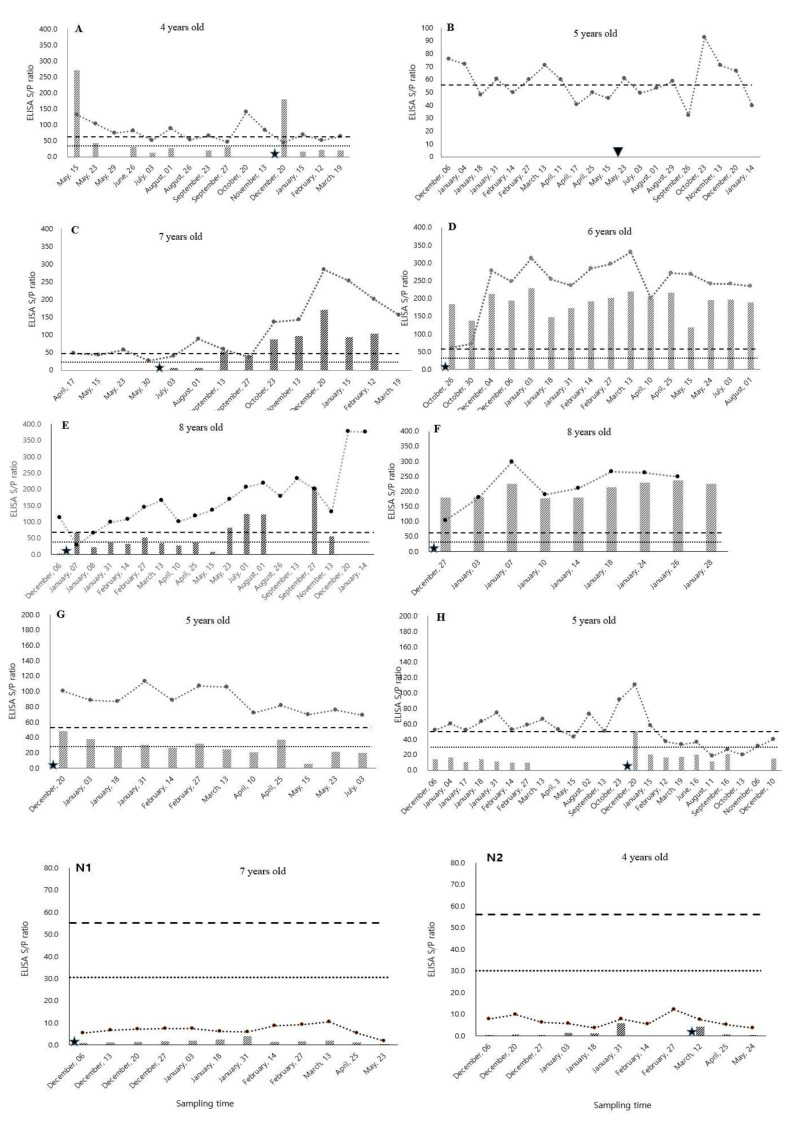
Figure 1.
Longitudinal temporal changes of Mycobacterium avium subsp. paratuberculosis (MAP) in the outcome of milk and serum ELISA in MAP-positive cows (cows A to H) and in control group (Cows N1 and N2). Each measurement reflects a test-day sampling result. Line graph: sample-to-positive ratio (S/P) of serum ELISA; bar diagram: S/P of milk ELISA; striped line: cut-off value for serum ELISA (S/P = 55); dotted line: cut-off value for milk ELISA (S/P = 30). The symbols ★ and ▼ indicate time of calving and abortion, respectively. Month and date reflect sampling time.

