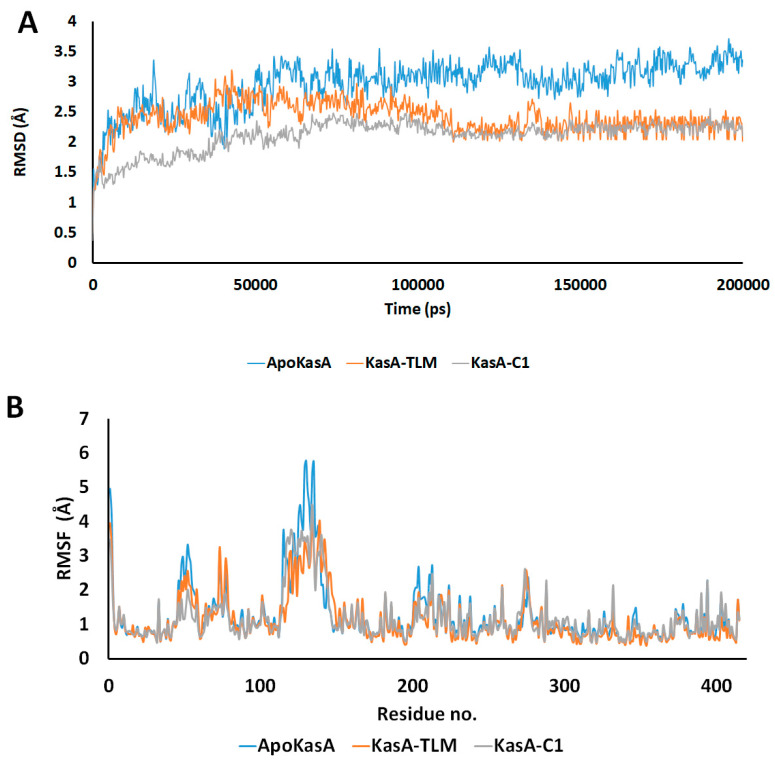
Figure 5.
(A) Time dependent RMSD of the α-carbon atom for ApoKasA, KasA bound with TLM, and KasA bound with the compound 1. The simulation was run for 200 ns. (B) Per-residue changes in root mean square deviation (RMSD) during 200 ns of simulation. The X-axis represents the residue number and the Y-axis is the RMSD of the α-carbon atom. The color blue, orange and grey represents the structures of ApoKasA, KasA bound with TLM, and KasA bound with the compound 1, respectively.

