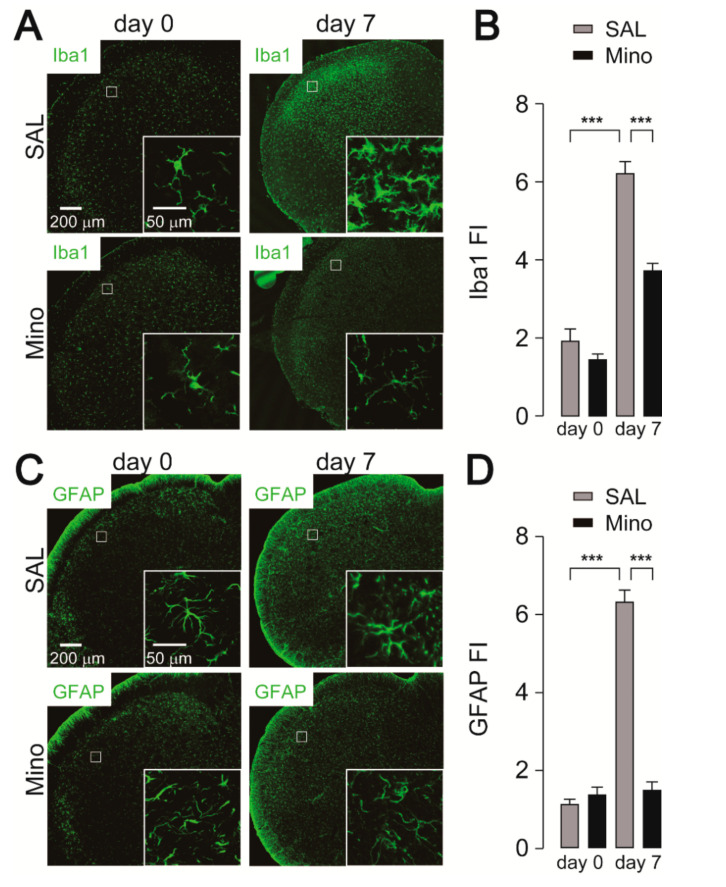
Figure 2.
Inhibitory effects of minocycline on cellular activation of microglia and astrocytes in the Vc following IONI. (A) Representative images of Iba1 immunofluorescence in the Vc. Insets indicate enlarged images of the region indicated in the open square. (B) Fluorescence intensity (FI) of Iba1 in the Vc of saline or minocycline-treated rats 0 and 7 days after IONI. SAL (day 0): n = 5, Mino (day 0): n = 5, SAL (day 7): n = 7, Mino (day 7): n = 10, two-way ANOVA followed by Tukey’s multiple comparison test, *** p < 0.001. (C) Representative images of glial fibrillary acidic protein (GFAP) immunofluorescence in the Vc. Insets indicate enlarged images of the region indicated in the open square. (D) Fluorescence intensity (FI) of Iba1 in the Vc of saline or minocycline-treated rats 0 and 7 days after IONI. SAL (day 0): n = 5, Mino (day 0): n = 5, SAL (day 7): n = 7, Mino (day 7): n = 10, two-way ANOVA Tukey’s multiple comparison test, *** p < 0.001. The data represent the means ± SEM.

