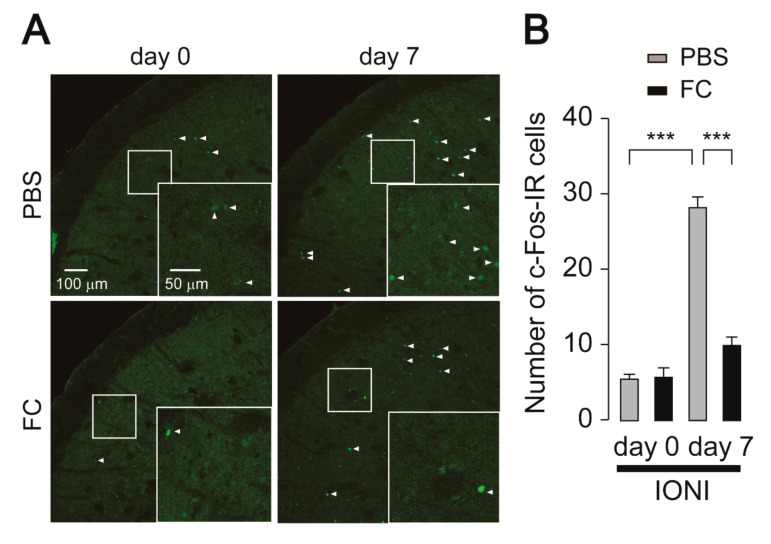
Figure 4.
Fluorocitrate attenuates c-Fos expression in the Vc following IONI. (A) Representative images of c-Fos immunofluorescence in the Vc. Insets indicate enlarged images of the region indicated in the open square. Arrowheads indicate c-Fos-IR cells. (B) The average number of c-Fos-IR cells in the Vc of PBS or fluoroacetate (FC)-treated rats 0 and 7 days after IONI. PBS (day 0): n = 5, FC (day 0): n = 5, PBS (day 7): n = 5, FC (day 7): n = 5, two-way ANOVA followed by Tukey’s multiple comparison test, *** p < 0.001. The data represent the means ± SEM.

