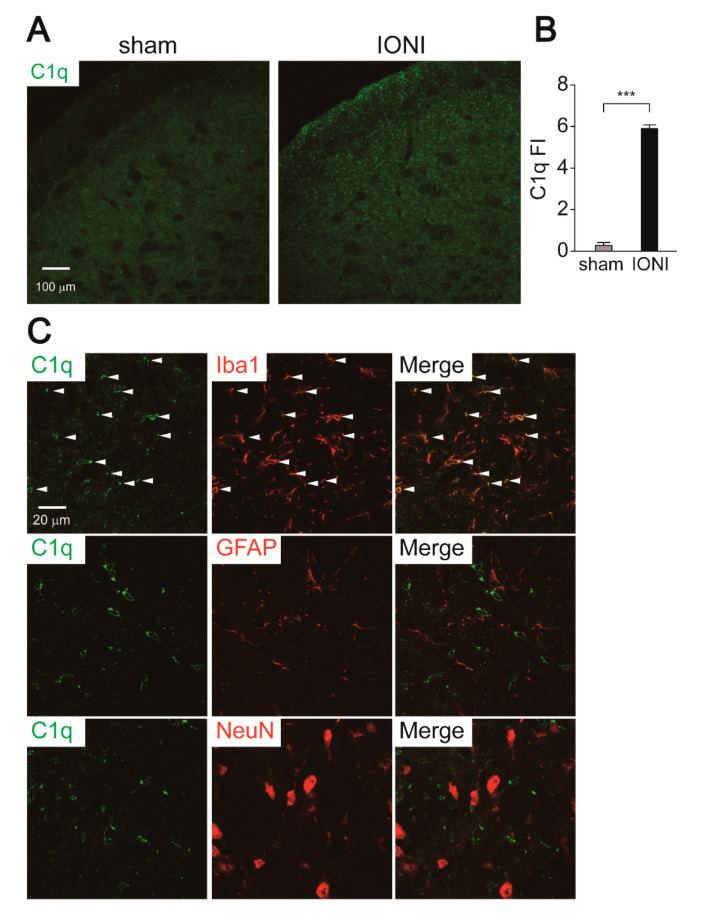
Figure 5.
Induction of C1q in the Vc following IONI. (A) Representative images of C1q immunofluorescence in the Vc on day 7 of sham and IONI rats. (B) C1q fluorescence intensity (FI) in the Vc 7 days after IONI. Sham: n = 5, IONI: n = 5, unpaired Student’s t-test, *** p < 0.001. (C) The images show double staining of C1q and Iba1, GFAP, and NeuN in the Vc. Arrowheads indicate colocalization of C1q and Iba1 immunofluorescence.

