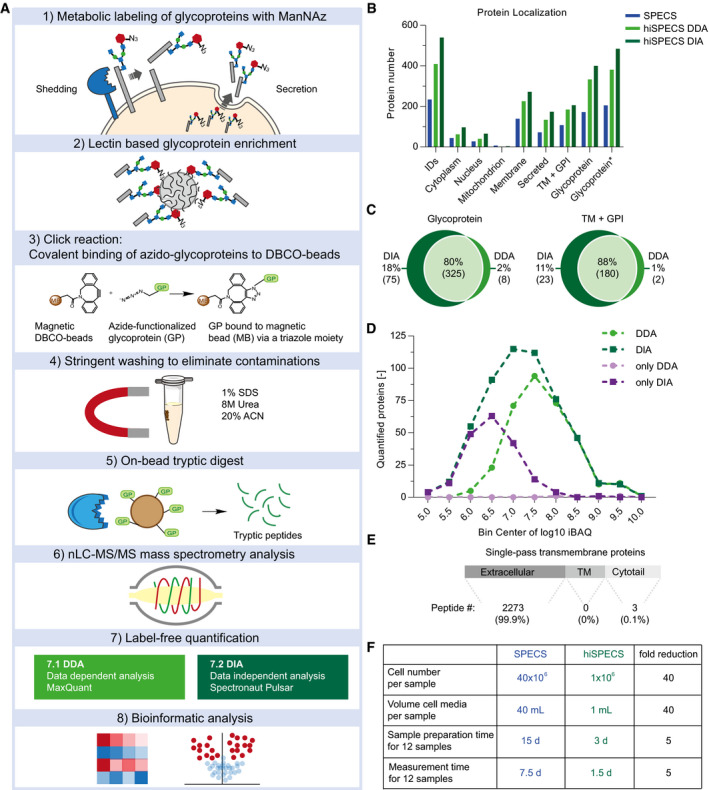
Figure 1. Workflow of the hiSPECS method and benchmarking against SPECS .

- Graphical illustration of the hiSPECS workflow. Cells are metabolically labeled with N‐azido‐mannosamine (ManNAz), an azido group‐bearing sugar, which is metabolized in cells and incorporated as azido‐sialic acid into N‐ and O‐linked glycans of newly synthesized glycoproteins, but not into exogenously added serum proteins. ACN: acetonitrile.
- Bar chart indicating protein quantification, protein localization (according to UniProt) in the secretome of primary neurons, comparing the previous SPECS (blue) to the new hiSPECS method using DDA (light green) or DIA (dark green). Proteins were counted if quantified in at least 9 of the 11 biological replicates of hiSPECS or 4 of 5 biological replicates of the previous SPECS paper (Kuhn et al, 2012). The category glycoprotein* includes UniProt annotations and proteins annotated as glycoproteins in previous papers (Zielinska et al, 2010; Fang et al, 2016; Liu et al, 2017; Joshi et al, 2018). Proteins can have multiple UniProt annotations, e.g., for APP membrane, TM, cytoplasm, and nucleus, because distinct proteolytic fragments are found in different organelles, so that some proteins in categories cytoplasm and nucleus may overlap with the categories secreted and TM + GPI. IDs: identified proteins.
- Venn diagram comparing the number of protein groups quantified (5/6 biological replicates) by DDA versus DIA of the same samples. Left panel: glycoprotein. Right panel: TM and GPI proteins, which are potentially shed proteins.
- Distribution of quantified proteins with DDA and DIA (at least in 3 of 6 biological replicates). The number of quantified proteins is plotted against the log10‐transformed intensity‐based absolute quantification (iBAQ) values with a bin size of 0.5. The iBAQ values roughly correlate with molar abundance of the proteins. Therefore, a difference in one in log10 scale represents a 10‐fold abundance difference. The number of quantified proteins per bin for DDA and DIA is indicated in light and dark green, respectively. Proteins that were only quantified with DDA or DIA are colored in light and dark purple, respectively.
- All tryptic peptides identified from TM proteins were mapped onto their protein domains. Only 0.1% of the peptides mapped to intracellular domains, demonstrating that secretome proteins annotated as TM proteins comprise the shed ectodomains, but not the full‐length forms of the proteins.
- Comparison of SPECS and hiSPECS method with regard to cell number, volume of culture media, sample preparation time, and mass spectrometer measurement time.
