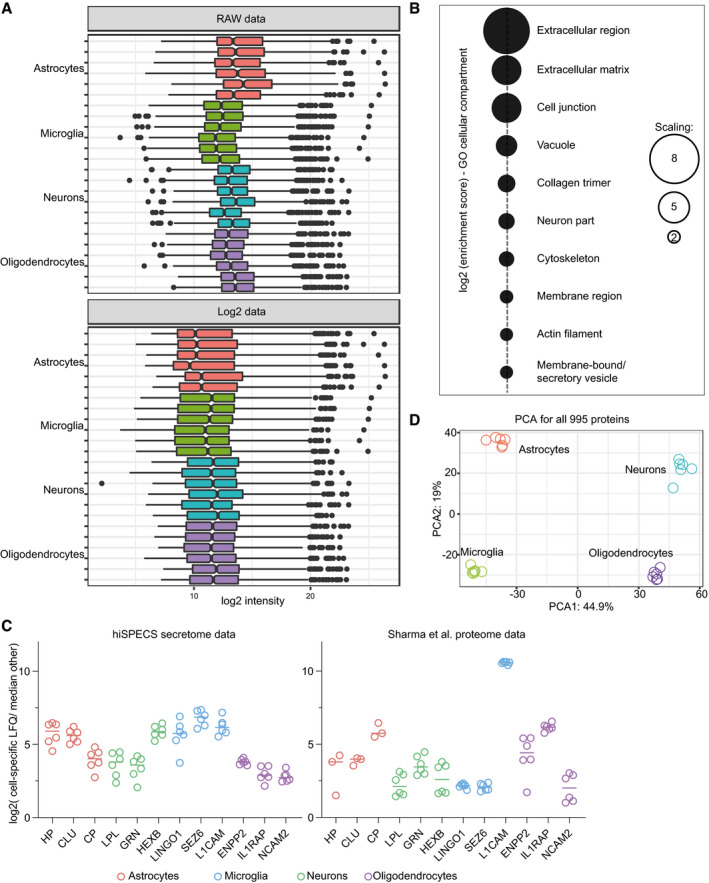
Fold change in cell type‐specific proteins in the brain cells. Log
2 ratio of the average abundance in the specific cell type to the median abundance in the other cell types in the hiSPECS secretome or lysate analysis (Sharma
et al,
2015) is shown. Known cell type‐specific marker proteins are highlighted for each cell type which reveals a strong enrichment in the lysate and secretome of the primary brain cells verifying the quality and comparability of the primary cultures. For example, the ectodomain of the membrane protein NCAM2 (with an
y‐axis value of 3 in the log
2 scale) is secreted about eightfold more from oligodendrocytes compared with the median of the other three cell types and also expressed at a higher level in this cell type compared with the median of the other three cell types. Horizontal lines indicate the mean.

