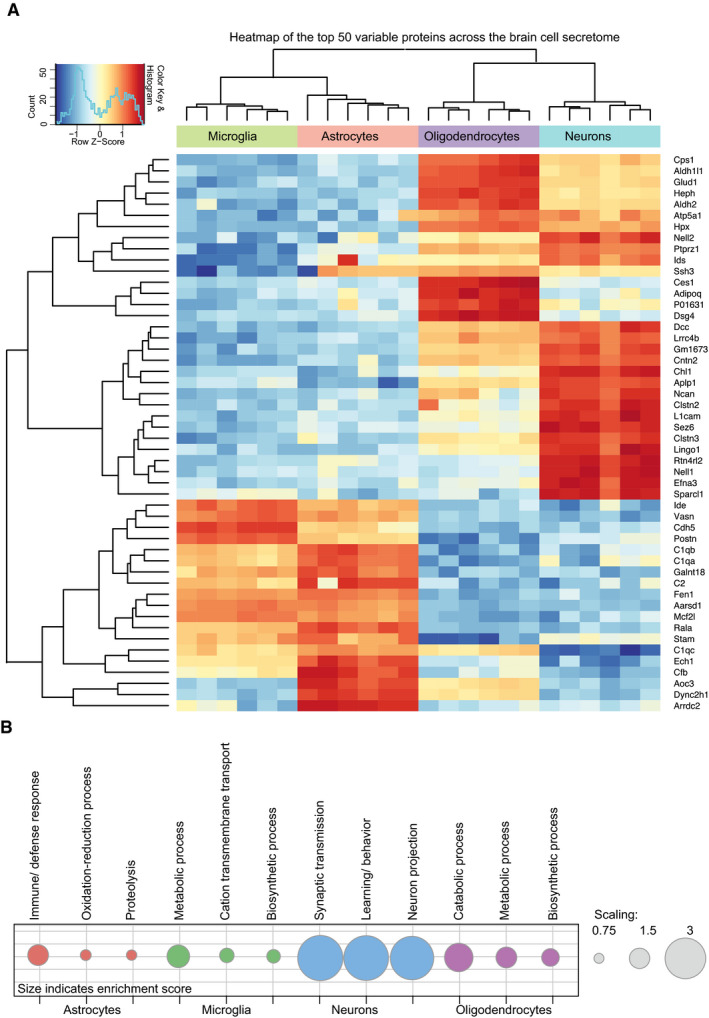
Heat map of the top 50 differentially secreted proteins (Bonferroni's
P.adj < 0.05 using the R package Limma (Ritchie
et al,
2015)) across the four cell types from hierarchical clustering. For the missing protein quantification data, an imputation approach was undertaken using data missing at random within a left‐shifted Gaussian distribution by 1.8 standard deviation. The rows represent the differentially secreted proteins, and the columns represent the cell types with their replicates. The colors represent log‐scaled protein levels with blue indicating the lowest, white indicating intermediate, and red indicating the highest protein levels.

