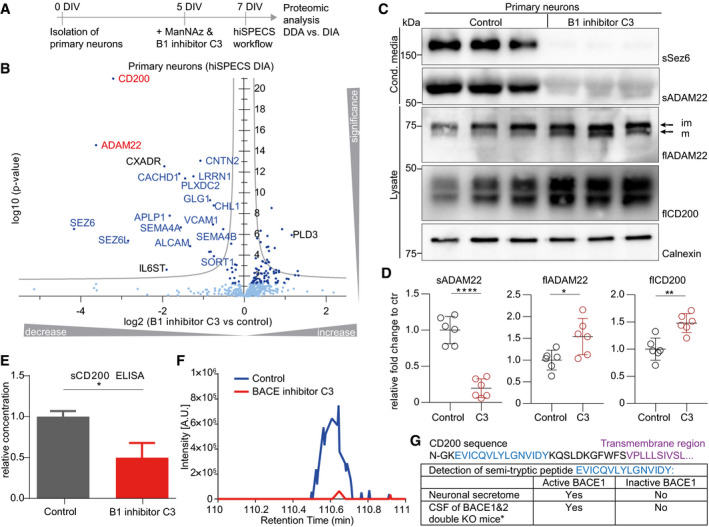
Figure 5. Identification and validation of substrate candidates of the protease BACE1.

- Experimental design of the ManNAz labeling step and BACE1 inhibitor C3 treatment of the primary neuronal culture for 48 h at 5–7 days in vitro (DIV).
- Volcano plot showing changes in protein levels in the secretome of primary neurons upon BACE1 inhibitor C3 treatment using the hiSPECS DIA method. The negative log10 P‐values (two‐sample t‐test) of all proteins are plotted against their log2 fold changes (C3 vs control) (N = 11). The gray hyperbolic curves depict a permutation‐based false discovery rate estimation (P = 0.05; s0 = 0.1). Significantly regulated proteins (P < 0.05) are indicated with a dark blue dot, and known BACE1 substrates are indicated with blue letters. The two newly validated BACE1 substrates CD200 and ADAM22 are indicated in red.
- Independent validation of the novel BACE1 substrate candidates CD200 and ADAM22 by Western blotting in supernatants and lysates of primary neurons incubated with or without the BACE1 (B1) inhibitor C3 for 48 h. Full‐length (fl) ADAM22 (mainly mature ADAM22, lower band) and CD200 levels in the neuronal lysate and were mildly increased upon BACE1 inhibition, as expected due to reduced cleavage by BACE1. Calnexin served as a loading control. The soluble ectodomain of ADAM22 (sADAM22) was strongly reduced in the conditioned medium upon BACE1 inhibition. Ectodomain levels of the known BACE1 substrate SEZ6 (sSEZ6) were strongly reduced upon BACE1 inhibition and served as positive control. Arrows indicate the mature (m) and immature (im) (before prodomain cleavage) form of ADAM22.
- Quantification of the Western blots in (C) (N = 6). Signals were normalized to calnexin levels and quantified relative to the control (ctr) condition. Statistical testing was performed with N = 6 biological replicates, using the one‐sample t‐test with the significance criteria of P < 0.05. According to this criterion, ADAM22 and CD200 were significantly increased in total lysates upon C3 treatment (flADAM22: *P‐value 0.0251, flCD200: **P‐value 0.011). Soluble ADAM22 was significantly reduced in the supernatant upon C3 treatment (****P‐value < 0.0001). The black central horizontal line indicates the mean and error bars, mean ± SD.
- The reduction in the soluble ectodomain of CD200 (sCD200) was detected by ELISA (one‐sample t‐test, *P‐value 0.0116), because the available antibodies were not sensitive enough for Western blots of the conditioned medium (N = 4). The mean and error bars are shown, mean ± SD.
- Extracted ion chromatogram of the semi‐tryptic peptide of CD200 in conditioned media of neurons comparing C3‐treated to control condition. Levels of the semi‐tryptic peptide were strongly reduced upon BACE1 inhibition.
- The potential cleavage site of CD200 was identified by a semi‐tryptic peptide indicated in blue, which is from the juxtamembrane domain of CD200. The transmembrane domain is indicated in purple. The semi‐tryptic peptide was found (i) using the hiSPECS method in the neuronal secretome under control conditions but not upon BACE1 inhibition, and ii) in the CSF of wild‐type mice but not upon knockout of BACE1 and its homolog BACE2—*data are extracted from (Pigoni et al, 2016). Because BACE2 is hardly expressed in brain, both datasets demonstrate that generation of the semi‐tryptic peptide requires BACE1 activity and thus represents the likely BACE1 cleavage site in CD200.
Source data are available online for this figure.
