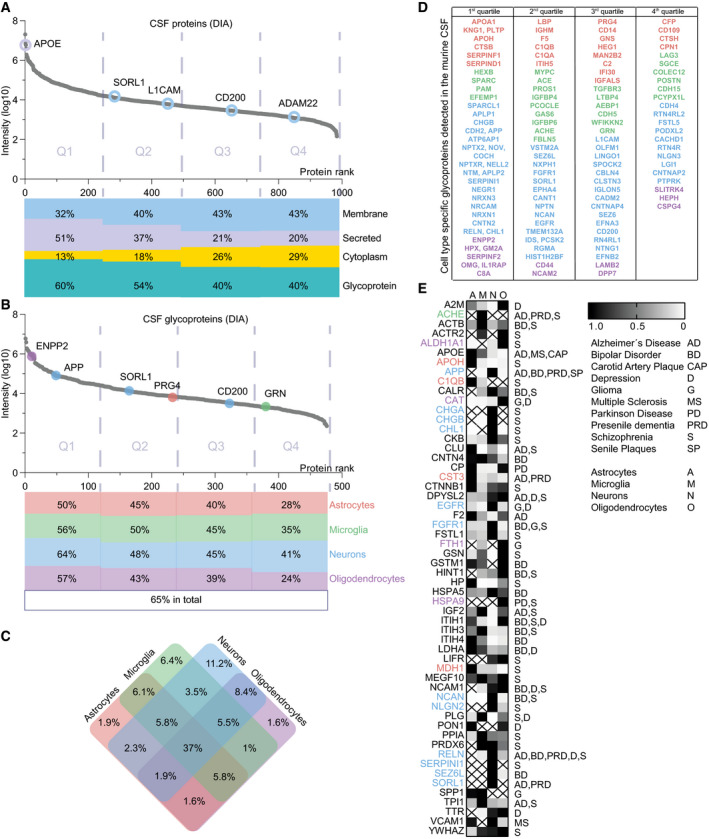
Figure 6. Mapping of murine CSF proteins to their probable cell type origin.

- Protein dynamic range plot of the log10‐transformed LFQ intensities of the murine CSF proteins quantified in at least 3 of 4 biological replicates measured with DIA. The proteins are split into quartiles according to their intensities, with the 1st quartile representing the 25% most abundant proteins. The percentage of proteins annotated in UniProt with the following subcellular locations/keywords are visualized for membrane, secreted, cytoplasm, and glycoprotein. Examples of cell type‐specifically secreted proteins are indicated with circles colored according to the UniProt annotation (purple: secreted, blue: membrane).
- Protein dynamic range plot of the log10‐transformed LFQ intensities specifically of glycoproteins in the murine CSF quantified in at least 3 of 4 biological replicates measured with DIA (N = 4). The proteins are split into quartiles according to their intensities. The percentage of proteins identified in the secretome of astrocytes, microglia, neurons, or oligodendrocytes in at least 5 of 6 biological replicates is illustrated below. Selected proteins specifically secreted from one cell type are indicated with the color code of the corresponding cell type.
- Venn diagram indicating the distribution of CSF glycoproteins detected in the hiSPECS secretome resource.
- Cell type‐specifically secreted proteins (CTSP) in the hiSPECS secretome study (fivefold enriched in pairwise comparison with the other cell types or only detected in one cell type) are listed according to their presence in the CSF quartiles. CTSP are color‐coded according to their origin: astrocytes (orange), microglia (green), neurons (blue), and oligodendrocytes (purple).
- List of proteins detected in murine CSF and the hiSPECS secretome resource which have human homologs that are linked to brain disease based on the DisGeNET database (Pinero et al, 2017) with an experimental index, e.i ≥ 0.9. Relative protein levels in the brain cell secretome are indicated (black high, white low abundance). Colored gene names indicate cell type‐specific secretion. Columns indicate astrocytes (A), microglia (M), neurons (N), and oligodendrocytes (O). X: not detected in secretome.
