
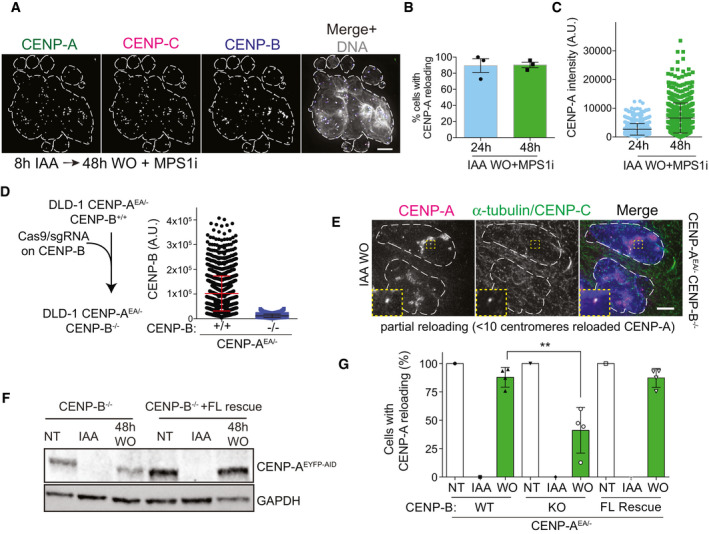
Figure EV3. (related to Fig 3). CENP‐B is a key factor for efficient de novo CENP‐A reloading.
-
ARepresentative immunofluorescence showing de novo CENP‐A deposition in CENP‐B (+/+) DLD‐1 cells after reversine‐induced chromosome mis‐segregation. DAPI staining is contoured by a white dashed line. Scale bar, 5 μm.
-
B, CBar graphs showing the relative number of CENP‐A-positive cells (B) and the level of centromeric CENP‐A level (C) in the presence of reversine. Each dot represents one experiment with more than 20 cells per condition. Error bars represent SD of 3 independent experiments.
-
DLeft: schematic of the CRISPR/Cas9 strategy to deplete CENP‐B in DLD‐1 cells as measured in the dot plot on the right. Each dot represents one centromere, and error bars show standard deviation.
-
EImmunofluorescence images showing partial de novo CENP‐AEA reloading (< 10 centromeres) in CENP‐B−/− DLD‐1 cells in late M phase. Nuclei of daughter cells are highlighted with white dashed lines. Scale bar, 5 μm.
-
FImmunoblot of total protein levels in the indicated conditions in the indicated cell line. FL = full length.
-
GBar graphs showing the relative number of DLD‐1 cells with centromeric CENP‐A in indicated conditions in the indicated cell line. Each dot represents one single experiment, > 30 cells per condition. Unpaired t‐test, **P = 0.0053, error bars represent SD of 4 independent experiments.
Source data are available online for this figure.