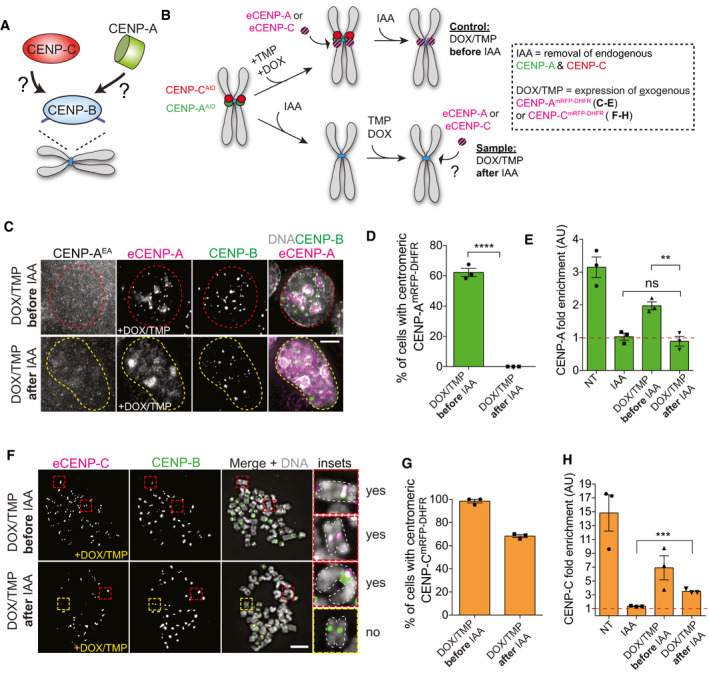
Schematic to illustrate the goal of this experiment.
Schematic illustration of the experiments performed in C‐H.
Representative immunofluorescence images showing exogenous CENP‐AmRFP‐DHFR reloading in the presence (control), but not in the absence (sample) of endogenous CENP‐A and CENP‐C. Scale bar; 5 μm. Chromosomes with centromeric CENP‐A are marked with a red dashed contour line, while a yellow contour line marks cell chromosome without centromeric CENP‐A.
Quantification of relative number of cells showing centromeric eCENP‐AmRFP‐DHFR in the indicated conditions. Error bars represent SEM from 3 independent experiments. Each dot represents one independent experiment with at least 30 cells per condition. Unpaired t‐test, ****P < 0.0001.
Bar plot of CUT&RUN–qPCR quantification using CENP‐A antibody and primers binding at the centromere of chromosome 4. Enrichment is measured relative to the IgG control and normalized to Alu repeats. Error bars represent SEM from 3 independent experiments. Each dot represents one independent experiment. Unpaired t‐test, **P = 0.0048.
Representative immunofluorescence chromosome spreads showing reloading of exogenous eCENP‐CmRFP‐DHFR in the presence (control) and in the absence (sample) of endogenous CENP‐A and CENP‐C. Cells were arrested with colcemid for 3 h prior to spread. Cells with centromeric CENP‐C are marked with a red dashed contour line, while a yellow contour line marks cell without centromeric CENP‐C. Chromosomes in inset are highlighted using a white dashed line. Scale bar, 5 μm.
Quantification of relative number of cells with eCENP‐CmRFP‐DHFR in the indicated conditions. Each dot represents one independent experiment with at least 30 cells per condition. Error bars represent SEM from 3 independent experiments.
Bar plot of CUT&RUN–qPCR results using CENP‐C antibody and primers binding at the centromere of chromosome 4. Enrichment is measured relative to the IgG control and normalized to Alu repeats. Each dot represents one independent experiment. Error bars represent SEM from 3 independent experiments. Unpaired t‐test, ***P = 0.0003.