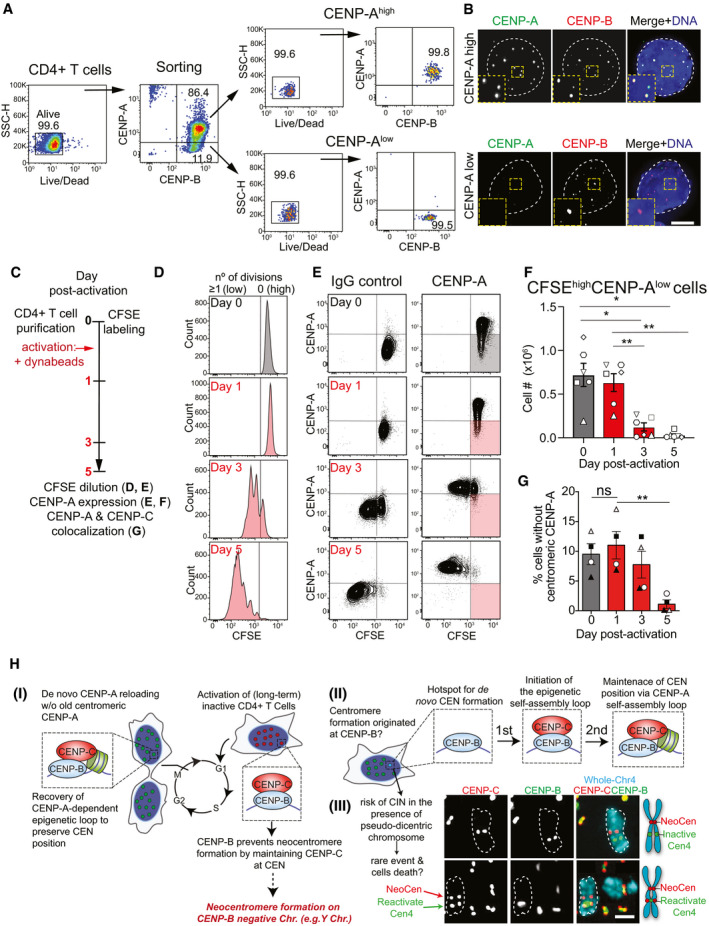
Gating strategy for the sorting of freshly purified resting human CD4+ T cells based on CENP‐A expression. Dead cells were excluded (first plot) using Fixable Viability Dye eFluor 780, and CENP‐Ahigh and CENP‐Alow cells (both CENP‐B+) were sorted (second plot). Post‐sort analysis of each population is then shown (third and fourth plots).
Representative images of sorted CD4+ T cells with high or low CENP‐A level. The nucleus is contoured by a white dashed line. Scale bar, 5 μm.
Schematic representation of the analysis of CENP‐A expression over time in CD4+ T cells, shown in D‐G. T cells were activated with anti‐CD3/anti‐CD28-coated beads.
Tracking of cell division by CFSE dilution. The black line separates cells that have not divided (no of div = 0, CFSE high) from those that have undergone at least one division (no of div ≥ 1, CFSE low).
CENP‐A expression and CFSE dilution. Black lines were set based on CENP‐A isotype control and CFSE maximal staining at day 0 (cells in shaded quadrants are CFSE‐high/CENP‐A-low). One representative donor is depicted.
Absolute number of CFSE‐high/CENP‐A-low CD4+ T cells (shaded gate in E). Symbols represent individual donors. Error bars represent SEM from 6 independent donors. One‐way ANOVA, multiple comparisons, n = 6. *P < 0.05; **P < 0.01.
Frequency of cells without centromeric CENP‐A determined by immunofluorescence microscopy before and post‐activation. Symbols represent individual donors, n = 4. Error bars represent SEM from 4 independent donors. Unpaired t‐test: **P = 0.0064.
Model of the role of CENP‐B in the maintenance of centromere identity. I‐III: See text for details. In III: (top) representative image of a pseudodicentric chromosome in PD‐NC4 cells with an active (red) and inactive (green) centromere bound by CENP‐C and CENP‐B, respectively; (bottom) example of a rare centromere re‐activation in which the inactive (red) centromere gains CENP‐C binding capacity. White dashed lines contour representative chromosomes. Schematic to the right illustrates the observed CENP‐C and CENP‐B localization patterns on a chromosome.

