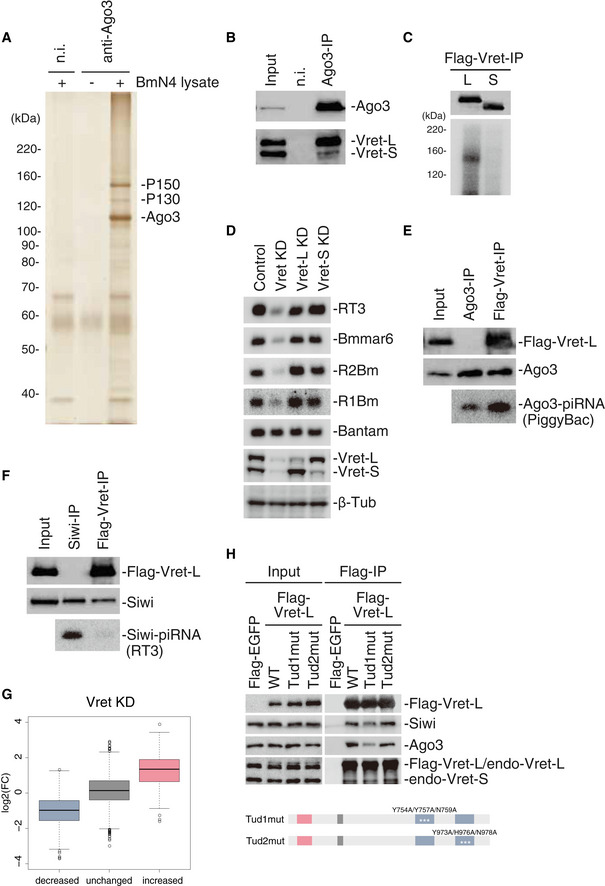
Figure 1. Vret interconnects Ago3‐piRISC and unloaded Siwi for secondary Siwi‐piRISC production.

- Silver staining of protein components in the Ago3 complex immunoisolated from BmN4 cells. P150 and P130 co‐immunoprecipitated with Ago3. n.i.: non‐immune IgG.
- Western blots showing the presence of Vret‐L (P150) and Vret‐S (P130) in the Ago3 complex in A. n.i.: non‐immune IgG.
- Top: Western blot showing Vret‐L and Vret‐S immunoprecipitated from BmN4 cells upon UV irradiation. Bottom: CLIP signals showing that Vret‐L, but not Vret‐S, binds RNAs in vivo.
- Five upper panels: Northern blots showing the levels of RT3‐piRNA, Bmmar6‐piRNA, R2Bm‐piRNA, and R1Bm‐piRNA in normal (Control), Vret‐L/S-depleted (Vret KD), Vret‐L-depleted (Vret‐L KD), and Vret‐S-depleted (Vret‐S KD) cells. Bantam (miRNA) was detected as a loading control. Two lower panels: Western blots showing the efficiency of the Vret knockdown. β‐Tub was detected as a loading control.
- Two upper panels: Western blots showing the abundances of Flag‐Vret-L and Ago3 in both samples. Note that Flag‐Vret-L is present only in the Vret‐L complex but not with Ago3 isolated from total cell lysates (Fig EV1F). Bottom panel: Northern blot showing the level of PiggyBac‐piRNA associated with Ago3 in total lysate (Ago3‐IP) and in the Vret‐L complex (Flag‐Vret-IP). The ratio of the piRNA signal intensity in the two samples is indicated at the bottom.
- Two upper panels: Western blots showing the abundances of Flag‐Vret-L and Siwi in both samples. Bottom panel: Northern blot showing the level of RT3‐piRNA associated with Siwi in the total lysate (Siwi‐IP) and in the Vret‐L complex (Flag‐Vret-IP).
- Boxplot showing log2 fold‐change of Vret KD (RPM)/Control (RPM) values of piRNAs in increased, unchanged and decreased groups defined by Ago3‐KD (RPM)/Control (RPM) values shown in Fig EV1I. Boxplot represents median, first and third quartile, and maximum and minimum values of the log2 fold‐change of piRNAs (N = 2). Outliers are represented as open circles.
- Flag‐EGFP and ‐Vret-L WT and mutants were immunoprecipitated using the anti‐Flag antibody and then Western blotting was performed using anti‐Flag, anti‐Siwi, anti‐Ago3, and anti‐Vret antibodies. The domain structures of Tud1mut (Y753A/Y757A/N759A) and Tud2mut (Y973A/Y976A/N978A) are shown.
Source data are available online for this figure.
