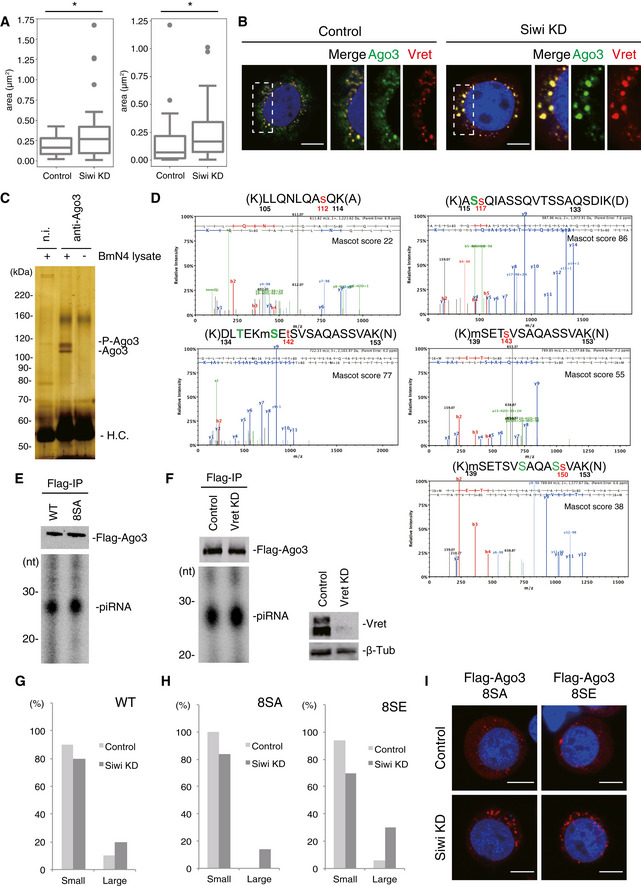
Figure EV3. Ago3 phosphorylation in Siwi‐depleted cells.

- Boxplot represents median, first and third quartile, and maximum and minimum values of the size of Ago3 particle (left panel; Control; n = 32, Siwi KD; n = 37) and Vret particle (right panel; Control; n = 54, Siwi KD; n = 26). Outliers are represented as filled circles. To calculate the size of nuage, we subtracted the background from the original images and generated binary images. After separating the adjacent object by the watershed algorithm and reducing noise, the area of nuage was obtained by Analyze Particles in ImageJ. P‐values were calculated by Brunner‐Munzel test using Scipy. *P < 0.05.
- Immunofluorescence showing the Ago3 signals (green) and the Vret signals (red) in control and Siwi‐depleted BmN4 cells (Siwi KD). DAPI shows the nuclei (blue). Scale bar: 10 μm. The three panels on the right‐hand side show high magnification images of the part indicated by the white dashed line box in the left‐hand side images.
- Silver staining showing unphosphorylated and phosphorylated Ago3 immunoisolated from Siwi‐depleted BmN4 cells.
- Representative ETD tandem mass spectra for Ago3 peptides, which include serine modifications. Mascot scores are shown on the top right of each spectrum.
- 32P‐labeling shows the levels of piRNAs loaded onto Flag‐Ago3 WT and 8SA.
- 32P‐labeling shows the level of piRNAs loaded onto Flag‐Ago3 is not affected by Vret depletion. Vret and β‐Tub as a loading control were also detected by Western blotting.
- Bar chart indicates dot sizes of > 100 Flag‐Ago3 WT particles under control and Siwi‐depleted conditions (Large: IntDen value > 105; Small: IntDen value < 105).
- Bar chart indicates dot sizes of > 100 Flag‐Ago3 8SA/8SE particles under control and Siwi‐depleted conditions (Large: IntDen value > 105; Small: IntDen value < 105).
- Immunofluorescence showing the Flag‐Ago3 8SA and 8SE mutant signals (red) in normal (Control) and Siwi‐depleted BmN4 cells (Siwi KD). DAPI shows the nuclei (blue). Scale bar: 10 μm.
Source data are available online for this figure.
