
Figure EV1. Isolation of stem cell nuclei and RNA comparison.
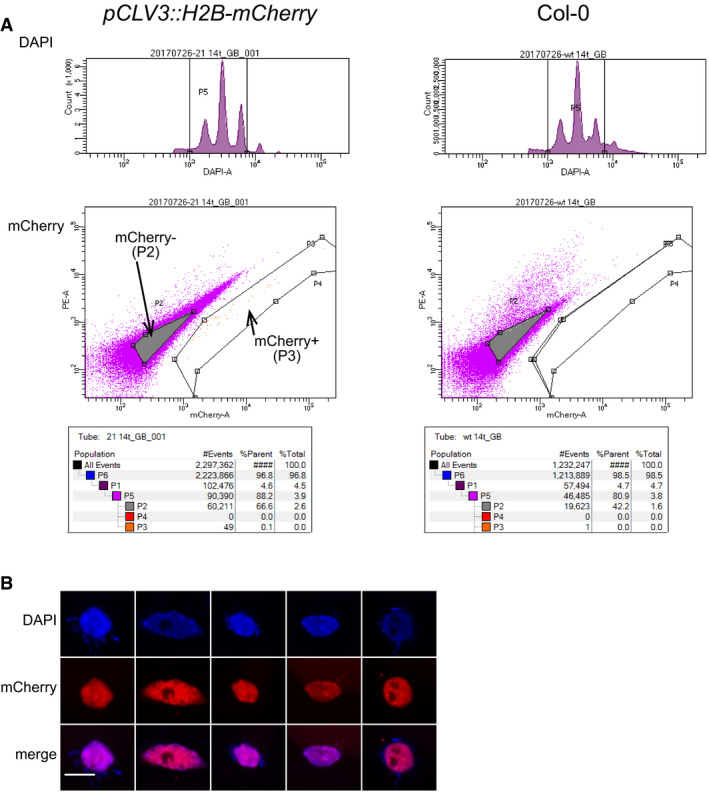
- Gating strategy used for FANS of stem cells. Representative FANS plots are shown. Events are gated for DAPI (top row) and next either for mCherry+ or mCherry− (bottom row). For numbers, see also Appendix Table S1. Reprinted with permission from Gutzat and Mittelsten Scheid (2020).
- Examples of mCherry‐positive nuclei after FANS (scale bar 5 μm).