
Figure 2. Differential RNA expression in SAM stem cells during development.
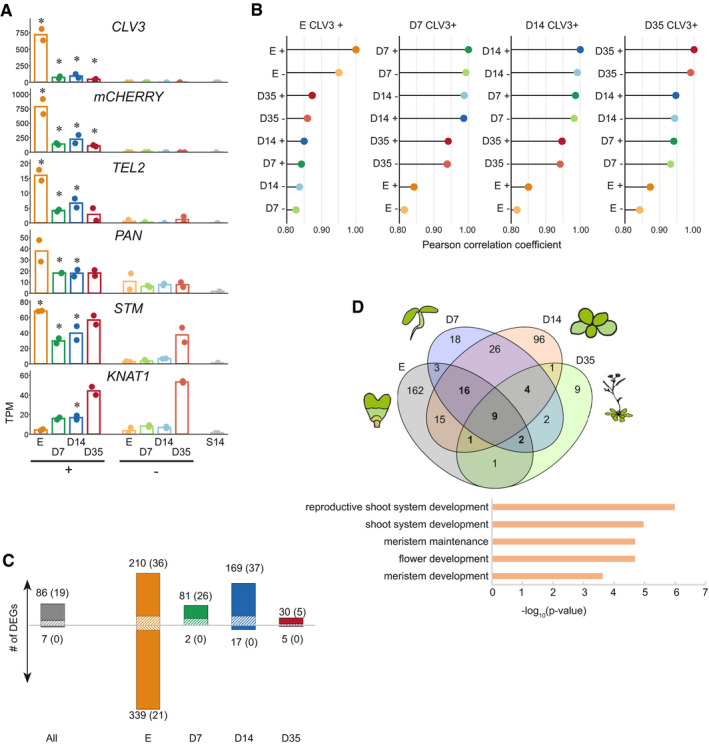
- Expression of CLV3, mCherry, TEL2, PAN, and the meristem marker genes STM and KNAT1. Asterisks indicate time points of significantly different expression (Wald test, Benjamini & Hochberg corrected, q < 0.05) between stem and non‐stem cells for each time point (N = 2). + = stem cell nuclei; − = non‐stem cell nuclei, E = nuclei from embryos, D7/14/35 = nuclei from 7/14/35‐day-old plants, S14 = nuclei from 14‐day-old above‐ground seedlings.
- Global gene expression correlations at different developmental stages of stem (+) and non‐stem cell (−) nuclei.
- Number of DEGs between stem and non‐stem cells at each time point. The banded portion of the bars indicates the number of transcription factor genes (also in parenthesis).
- Overlap of genes with higher expression in stem cells (excluding mCherry) and significant GO terms for shared DEGs (increased expression during at least three time points). See also Appendix Fig S2 for P‐values of overlapping gene sets. P‐values were calculated with Fisher's exact test and Bonferroni‐corrected (see also Table EV3).