
Figure EV2. Correlation of genomic features.
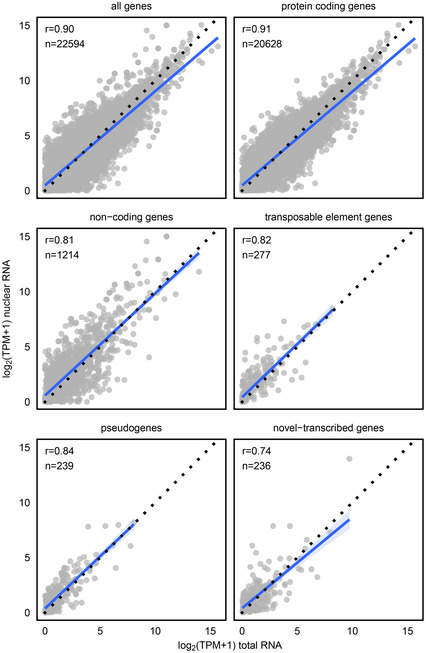
Log2‐normalized TPM values of nuclear and total RNA extracted from 14‐day‐old seedlings for different genomic features. Only expressed features were used (TPM > 0 in at least one sample). Shown is the number of features and Pearson correlation coefficients.