
Figure 3. Expression analysis of genes related to epigenetic regulation.
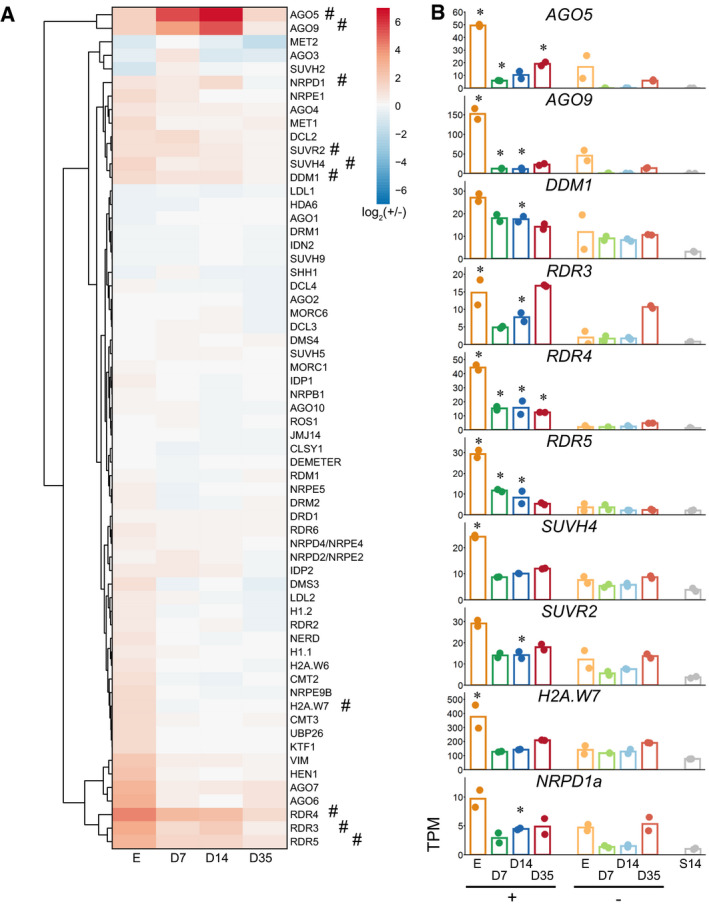
- Clustered expression heatmap.
- Expression of individual significantly up‐regulated genes marked with # in (A). Asterisks indicate time points of significantly different expression (Wald test, Benjamini & Hochberg corrected, q < 0.05) between stem and non‐stem cells for each time point (N = 2). + = stem cells; − = non‐stem cells, E = nuclei from embryos, D7/14/35 = nuclei from 7/14/35-day‐old plants, S14 = nuclei from 14‐day-old above‐ground seedlings.