
Figure EV3. Growth stages used for genome‐wide expression and DNA methylation analysis in stem and non‐stem nuclei.
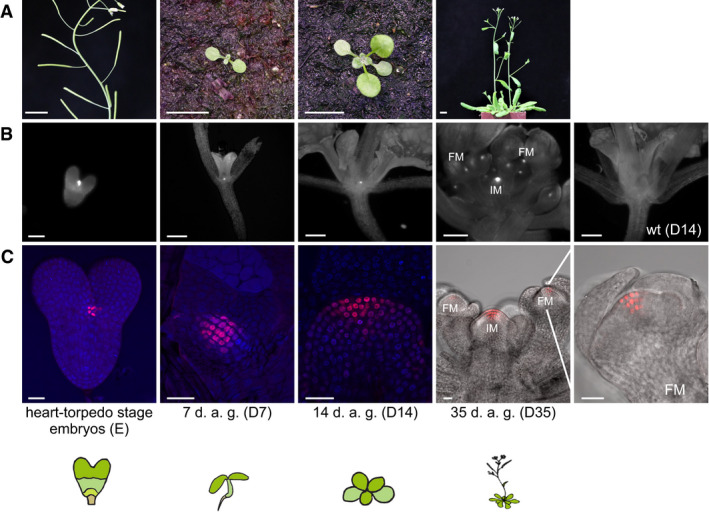
- Developmental stages of representative plants (scale bars 1 cm).
- Wide‐field microscopic images with RFP filters.
- LSM pictures of representative plants. For better visualization, DAPI was used as counterstain in E, D7 and D14. FM, floral meristem; IM, inflorescence meristem.