
Figure 7. DNA methylation changes at TEs.
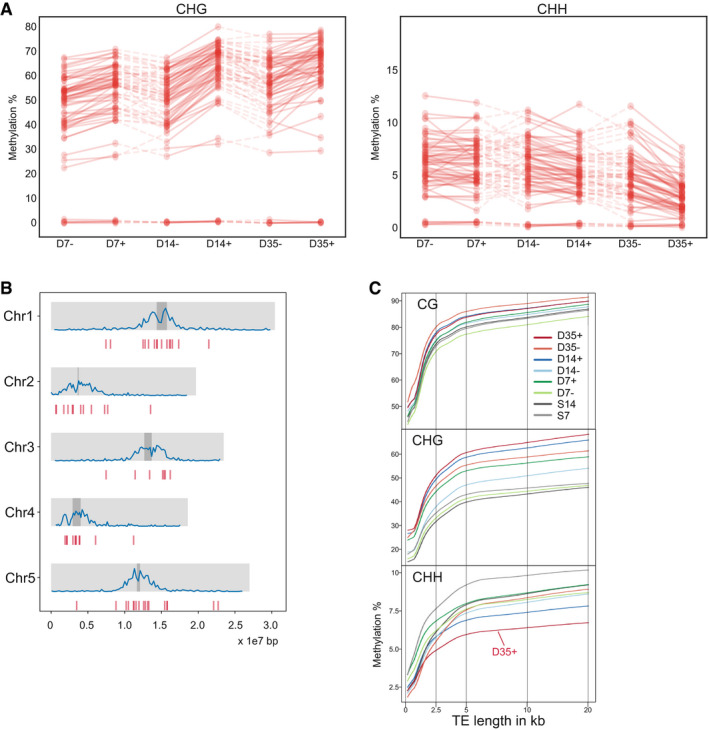
- DNA methylation in % at CHG (left) and CHH (right) sites in TE with increased expression at D7, compared between developmental stages (D7/14/35 = 7/14/35‐day-old plants) and nuclei of stem (+) and non‐stem (−) cells.
- Genomic location of the TEs (blue) from (A) on the five chromosomes. Dark gray bars indicate the location of centromeres, and blue lines indicate global TE density.
- Locally weighted scatterplot smoothing fit of CG, CHG, and CHH methylation levels in stem cells and non‐stem cells plotted on TE length. + = stem cells; − = non‐stem cells, E = nuclei from embryos, D7/14/35 = nuclei from 7/14/35‐day-old plants, S7/14 = nuclei from 7/14-day‐old above‐ground seedlings.