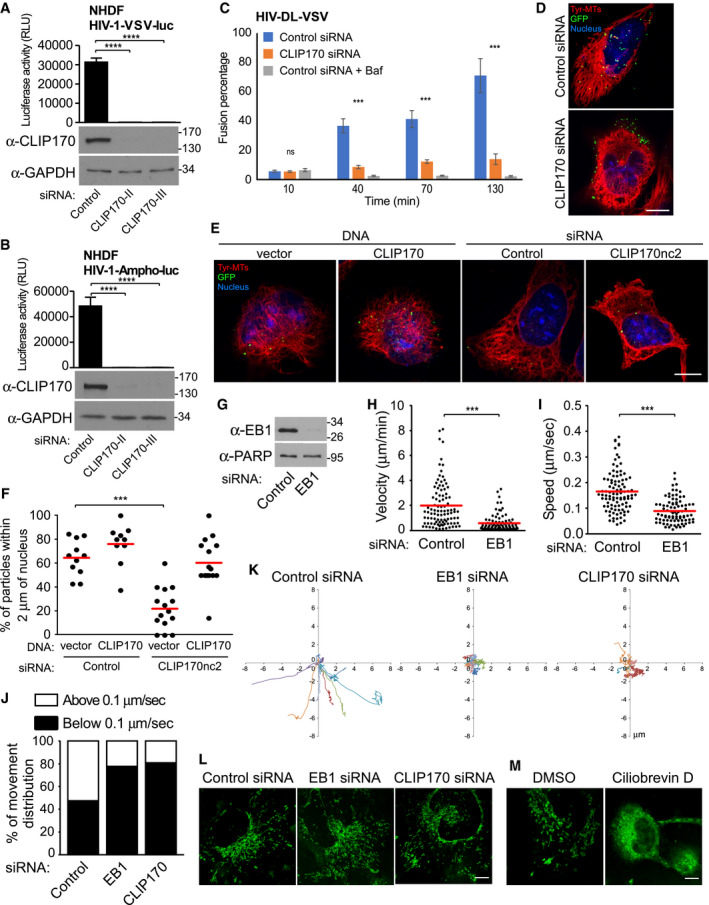
Figure EV1. EB1‐associated +TIP, CLIP170, promotes post‐entry stages of HIV‐1 infection.

-
A, BNHDF cells were treated with control siRNAs or siRNAs specific to CLIP170 (CLIP170‐II or CLIP170‐III). Cells were either lysed and analyzed by WB analysis using antibodies against CLIP170 and GAPDH (loading control) or infected with HIV-1‐VSV-luc (A) or HIV‐1-Ampho‐luc (B) as indicated, followed by measurements of luciferase activity. Statistical significance was determined by one‐way ANOVA. ****P < 0.0001. Data are mean values from three independent experiments ± SD.
-
CControl or CLIP170 siRNA‐treated CHME3 cells were left untreated or treated with bafilomycin A1 for 2 h during spinoculation followed by infection with HIV‐1-VSV containing Vpr‐GFP and S15 Tomato (HIV‐1-DL-VSV). Percentage fused viral particles (GFP‐Vpr+/S15-tomato−) is shown at the indicated times post‐infection. Data represent mean of ≥ 815 virus particles analyzed in ≥ 10 fields of view (≥ 14 cells) for each condition. ***P < 0.001. One‐way ANOVA was used to calculate statistical significance (mean ± SEM).
-
DCHME3 treated with control or CLIP170 siRNAs were infected with HIV‐1-WT-GFP‐Vpr. Representative images of Tyr‐MTs, viral particles (GFP), and the nucleus (Hoescht) from Fig 2F are shown. Scale bar, 10 μm.
-
E, FExogenous expression of CLIP170 enhances the translocation of HIV‐1 cores and rescues the effects of siRNA‐mediated CLIP170 depletion. 293A cells treated with control siRNA or a siRNA targeting the 3′UTR of CLIP170 (CLIP170nc2) were transfected with either empty vector (pQCXIN) or Flag‐tagged CLIP170 constructs after 24 h, followed by infection with Mock (not shown) or HIV‐1-VSV‐GFP-Vpr. (E) Representative staining images for tyrosinated tubulin (Tyr‐MTs), viral particles (GFP), and the nucleus (Hoescht). Scale bar, 10 μm. (F) Percentage viral particles within 2 μm of the nucleus at 4 h.p.i, scatterplot with mean of ≥ 62 virus particles quantified in ≥ 10 cells per sample. Statistical significance was determined by one‐way ANOVA. ***P < 0.001.
-
G–KEB1 and CLIP170 facilitate trafficking of HIV‐1 particles toward the nucleus. (G‐I) CHME3 cells treated with control or EB1‐specific siRNAs were infected with HIV‐1-WT-GFP‐Vpr then imaged live at 1 fps for 5–10 min using a Zeiss motorized spinning‐disk confocal microscope with MetaMorph imaging software. Viral particles were tracked to quantify virus movements in trajectories using Fiji software with Mosaic plug‐in. (G) Depletion of EB1 was confirmed by WB analysis. PARP was used as loading control. (H, I) Scatterplots representing displacement over time tracked (velocity) (H) and cumulative distance travelled over time (speed) (I) in cultures from (G). Each dot represents one viral particle tracked, and the red line indicates the median. A total of 183 trajectories were analyzed from 22 movies. Statistical significance was determined by t‐test. ***P < 0.001. (J) The percent of viral particles in (H, I) or from Fig 2G and H with movement > 0.1 μm per second (indicative of MT‐based movement) or < 0.1 μm per second (indicative of actin‐based movement or free diffusion). (K) Representative viral particle trajectories in (H, I) or from Fig 2G and H are depicted on XY axis.
-
L, MIntegrity of cellular cargo trafficking was confirmed by mitochondria staining. (L) CHME3 cells treated with control, EB1, or CLIP170 siRNAs were incubated with MitoTracker® Green, and images were captured at 3 fps for 3 min. (M) Dynein‐dependent trafficking was confirmed using ciliobrevin D (dynein inhibitor) and mitochondria staining. Representative still images are shown. Similar results were obtained in three independent experiments. Scale bar, 10 μm (L, M).
