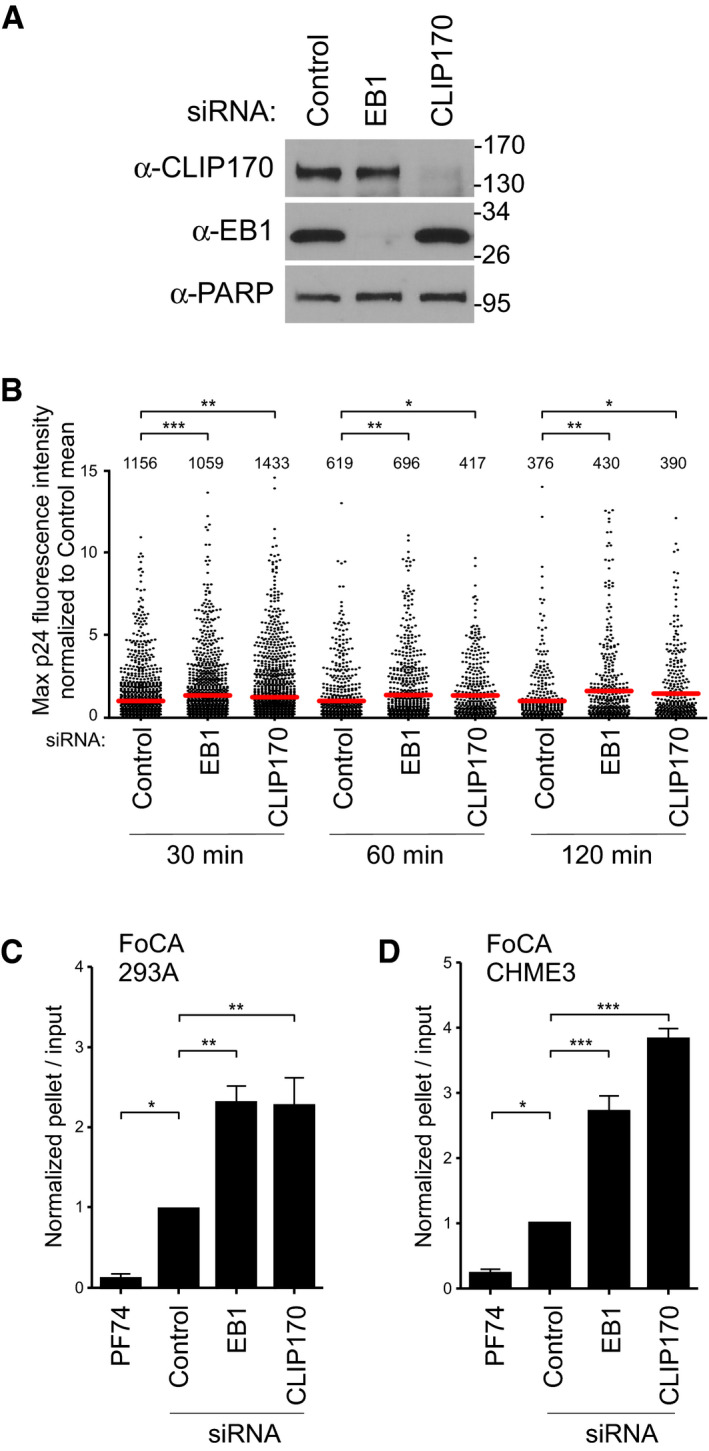
Figure 3. EB1 and CLIP170 facilitate uncoating of incoming HIV‐1 cores.

-
A, BCHME3 treated with negative control, EB1, or CLIP170 siRNAs was either lysed and analyzed by WB (A) or infected with GFP‐Vpr/S15‐tomato‐labeled VSV‐G pseudotyped HIV‐1 (B). Molecular weight markers (in kDa) are shown to the right of WBs in (A). Scatterplot of maximum p24 intensity of fused viral particles normalized to the control mean. Each dot represents one virion, and red lines indicate means. The number of viral particles analyzed per condition from three independent experiments is shown. Statistical significance was determined by one‐way ANOVA (*P < 0.05, **P < 0.01, ***P < 0.001).
-
C, DAmounts of pelleted p24 CA normalized to the input CA at 3 h.p.i. with HIV-1‐VSV-luc in 293A (C) or CHME3 (D) treated with control, EB1, or CLIP170 siRNAs. Mean ± SEM from three independent experiments is shown. Statistical significance was determined by one‐way ANOVA. Error bars = standard error of the mean (*P‐value ≤ 0.05, **P‐value ≤ 0.01, ***P‐value ≤ 0.001).
Source data are available online for this figure.
