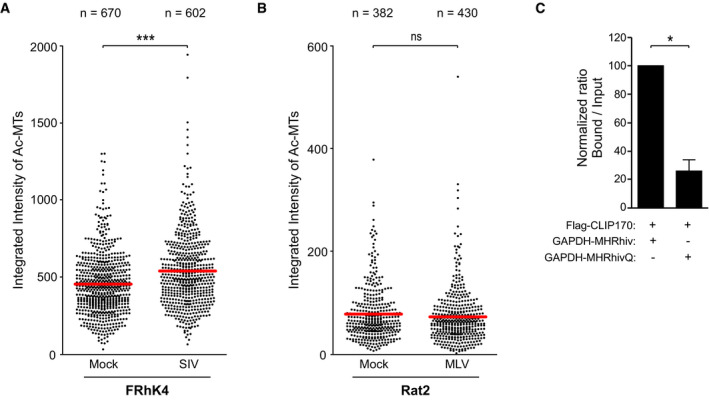
Figure EV5. Differential EB1 mimicry in MHR domains across retroviruses.

-
A, BQuantification of Ac‐MT fluorescence intensity in FRhK4 cells infected with SIV‐VSV-luc (A) or Rat2 cells infected with MuLV-VSV‐luc (B) and stained for Ac‐MTs and Tyr‐MTs in Fig 6F and G, respectively. Each dot represents one cell. The number of cells quantified (n) is indicated for each sample. The red line indicates the mean. Statistical significance was determined by t‐test. ***P < 0.001.
-
CQuantification of the levels of bound Flag‐CLIP170 as a ratio of total protein across experimental replicates (n = 3) in Fig 7L. Statistical significance was determined by t‐test, and data are shown as mean ± SEM. *P < 0.05.
