
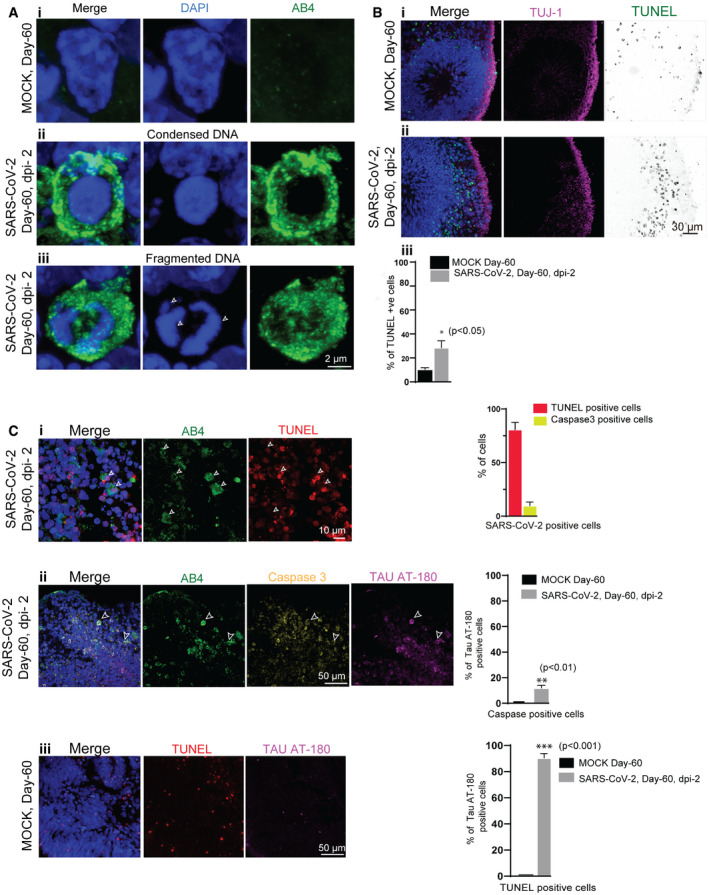
Figure 3. SARS‐CoV‐2 induces of neuronal death.
-
ACells from mock organoids display a healthy nucleus labeled by DAPI (blue) (i). SARS‐CoV-2‐positive cells (green) display condensed (middle panel, ii) and fragmented DNA (bottom panel, iii, arrows). At least 75 cells from two (n = 2) independent batches of organoids were examined. Figures display scale bars.
-
BCompared to mock organoids, (i) SARS‐CoV-2‐exposed organoids (ii) display increased TUNEL‐positive cells (displayed as inverted LUT) at the cortical plate that is specified by TUJ‐1 (magenta). At least four organoids from two (n = 2) independent batches of organoids were examined. Figures display scale bars. The bar diagram below quantifies the frequencies of TUNEL‐positive cells between mock and SARS‐CoV-2‐exposed organoids. Four organoids from two (n = 2) independent batches were examined. Unpaired t‐test, *P < 0.05. Data presented as mean ± SD.
-
CMost of the SARS‐CoV-2‐positive cells (AB4, green) are TUNEL‐positive (i) and some of the SARS‐CoV-2‐positive cells are caspase‐positive (ii). Caspase‐positive cells in SARS‐CoV-2‐exposed organoids display pT231Tau localization at the cell soma specified by AT‐180 (ii), which are not observed in mock organoids (iii). Arrowheads point SARS‐CoV-2‐positive cells (AB4, green) that are also positive for TUNNEL (red), caspase 3 (yellow), and Tau AT‐180 (magenta). Figures display scale bars. Bar diagrams at right quantifies proportions of TUNEL and caspase‐positive cells among SARS‐CoV-2‐positive cells. The second graph below quantifies the proportions of pT231Tau‐positive cells among caspase‐positive cells between control and virus exposed groups. At least 400 cells from four organoids and two independent (n = 2) batches were examined. Unpaired t‐test, **P < 0.01. Data presented as mean ± SEM. TUNEL‐positive cells in control un‐exposed organoids do not contain pT231Tau (iii). Figures display scale bars. Bar diagrams at right quantifies proportions of pT231Tau‐positive cells among TUNNEL‐positive cells between control and virus exposed groups. At least 350 cells from 4 organoids and two independent (n = 2) batches were examined. Unpaired t‐test, ***P < 0.001. Data presented as mean ± SEM.