
Figure 1. Functional screen using a luciferase reporter assay to identify RBPs inducing let‐7‐expression.
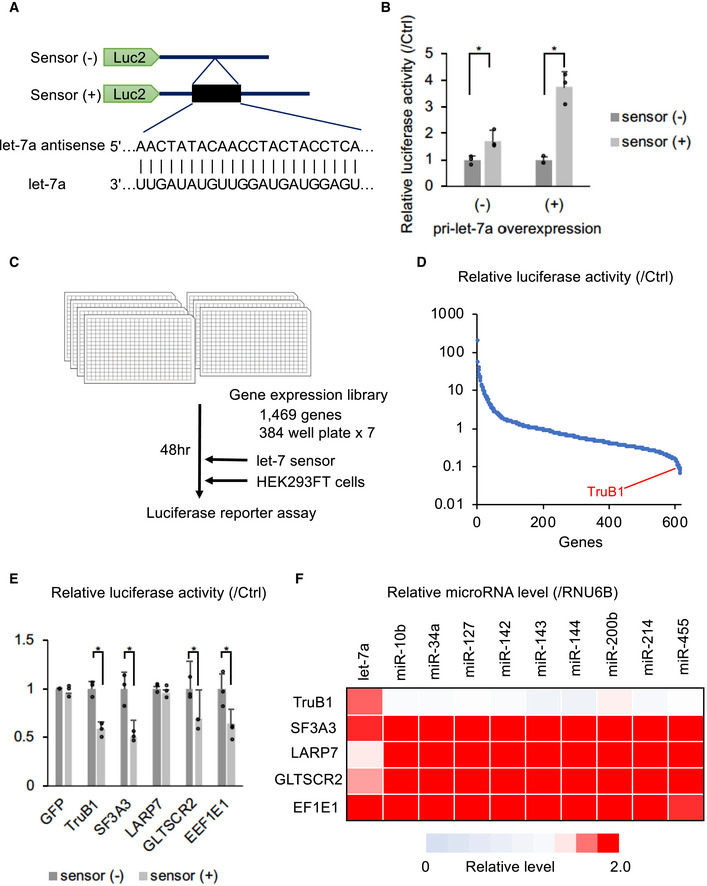
- Design of the let‐7 sensor reporter and sequence of let‐7a. Sensor (+) vector has the antisense sequence of let‐7a inserted into the 3′UTR of the luciferase gene.
- Relative luciferase activity of the let‐7 sensor reporter (sensor (+)) or the negative control sensor (−) reporter contransfected with pLX‐Lin28A in HEK293FT cells with or without pcDNA‐pri-let‐7a transfection. Error bars show SD; n = 3. Significance was assessed using 2‐tailed Student's t‐test, < 0.05*.
- The screening model. A screening in 384‐well plates with a library of 1,469 genes was performed.
- Screening results: relative luciferase activity of each gene in the library. Only genes that did not affect the luciferase activity of the sensor (−) reporter (0.5 <, > 2.0) were analyzed. The full results of the screen are also in Table EV1.
- Relative luciferase activity of the sensor (+) reporter or sensor (−) reporter induced by expression vectors of the top 5 genes identified in the screen or the GFP vector in HEK293‐FT cells. Error bars show SD; n = 3. Significance was assessed using 2‐tailed Student's t‐test, 0.05*.
- Heat map of relative miRNA expression of various miRNAs in HEK‐293FT cells transfected with expression vectors of the top 5 genes from the screen, or the ctrl (GFP) vector. Red color represents suppressed expression compared with ctrl (GFP). n = 3.
Source data are available online for this figure.