
Figure EV1. Schematic model of cell‐based functional screen and knockdown of TruB1 repressed expression of relative miRNAs in various human cells.
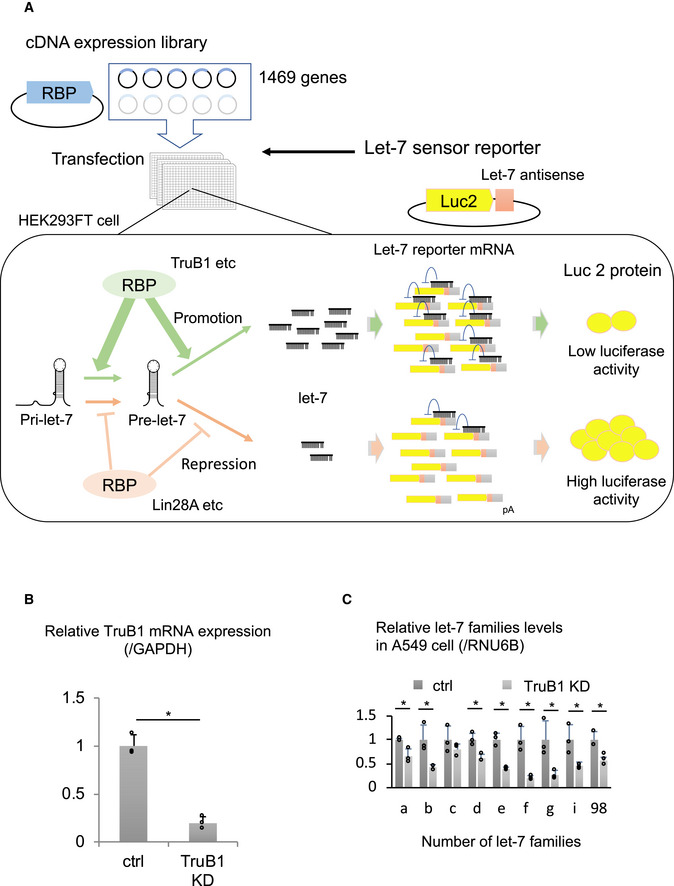
- Repressors of maturation such as Lin28 lead to high luciferase activity, and activators lead to low luciferase activity. This cell‐based screen is assaying for a function directly on endogenous let‐7 maturation, rather than affinity/binding. The gain‐of-function screen also enables to identify regulatory factors that may cause lethality under loss of function conditions, such as with Crispr‐Cas9 or RNAi‐KD screens.
- qRT–PCR analysis for TruB1 mRNA expression normalized to GAPDH with TruB1 KD or ctrl (siRNA). TruB1 KD by siRNA significantly repressed the expression of TruB1 mRNA in HEK‐293FT cells. Error bars show SD; n = 3. Significance was assessed using 2‐tailed Student's t‐test, < 0.05*.
- qRT–PCR analysis for let‐7 families levels in A549 cells with TruB1 KD or ctrl (siRNA). TruB1 KD by siRNA significantly repressed the expression of the let‐7 family. Error bars show SD; n = 3. Significance was assessed using 2‐tailed Student's t‐test, < 0.05*.
Source data are available online for this figure.