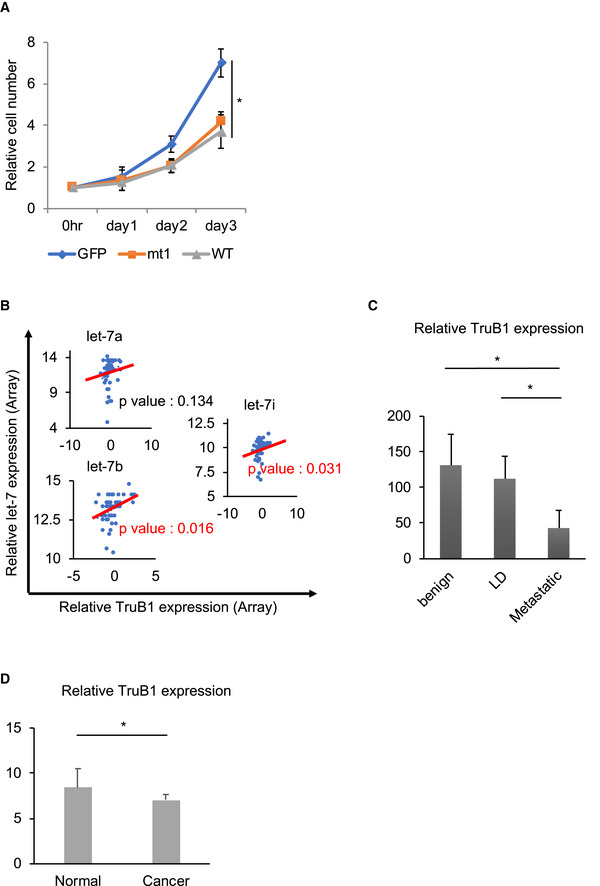
Figure EV5. TruB1 suppressed tumor progression.

-
ATruB1 and mt1 suppressed cell proliferation. Real‐time glo assay for HEK‐293 cells infected with tetracycline‐inducible lentiviruses expressing TruB1, mt1, or GFP, 5 days after doxycycline treatment. TruB1 and mt1 suppressed cell proliferation. Error bars show SD; n = 3. Significance was assessed using 2‐tailed Student's t‐test, < 0.05*.
-
B–DRelationship between TruB1, let‐7, and tumor progression in various cancers. (B) Published microarray and microRNA sequencing in prostate biopsy samples from patients with prostate cancer (data accessible at NCBI GEO database (Edgar et al, 2002), accession GSE64333, Wang et al, 2015a; Data ref: Wang et al, 2015b). In these data, there were correlations between the expression levels of TruB1 and both let‐7b and let‐7i. Regarding let‐7a, a statistically significant correlation was not found, but the same tendency was observed. Significance was assessed using Pearson product‐moment correlation coefficient. Regression lines were showed by red lines (C, D). TruB1 inversely correlates with tumor progression or oncogenesis in prostate cancer (C) and in pancreatic cancer (D). LD: local disease. Data from Varambally et al, 2005a; Data ref: Varambally et al, 2005b; Pei et al, 2009a; Data ref: Pei et al, 2009b. Error bar shows SD. Significance was assessed using 2‐tailed Student's t‐test, < 0.05*. The numbers of cases (C) were as follows: benign (n = 6), LD (n = 7), and ED (n = 6). The numbers of cases (D) were as follows: Cancer (n = 36) and normal (n = 16).
Source data are available online for this figure.
