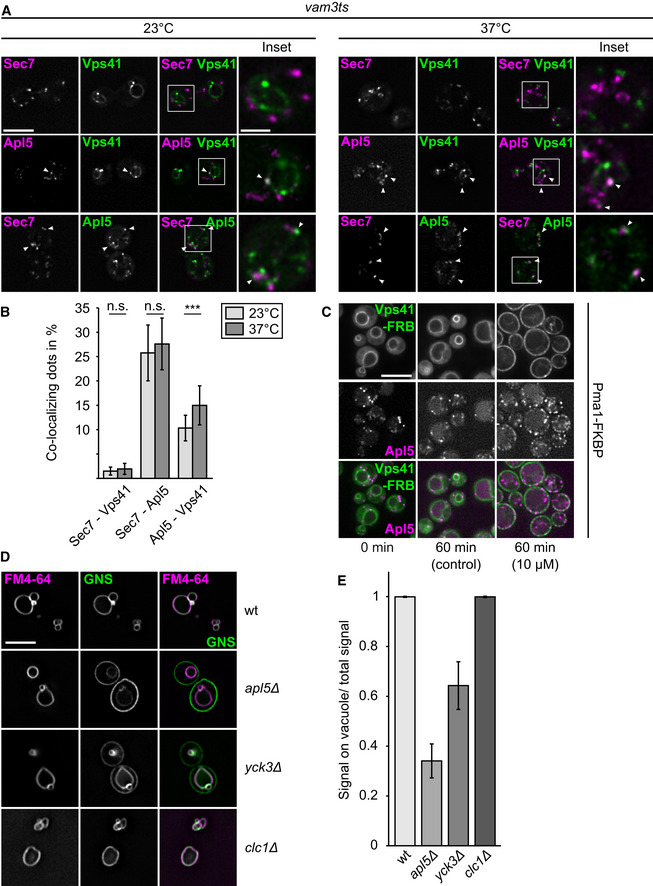
Figure 1. Function of possible coat proteins in AP‐3 vesicle formation.

- Co‐localization of c‐terminally GFP‐ or mCherry‐tagged Apl5, Sec7, and Vps41 in a vam3 temperature‐sensitive (ts) background strain. Cells were grown over night at 23°C and where indicated shifted to 37°C for 3 h prior to imaging. White arrowheads indicate co‐localization events. Scale bar, 5 μm. Scale bar in inset, 2 μm.
- Quantification of co‐localization events from (A). Single events were counted, and the percentage of co‐localization normalized to the number of Apl5‐punctae was plotted (n ≥ 187 cells). Bars show the mean percentage of co‐localization ± standard deviation. Significance was determined with a two‐tailed t‐test (***P ≤ 0.001).
- Re‐localization of Apl5 upon Vps41 re‐localization. Vps41 was tagged with a C‐terminal FRBGFP tag in a strain, where Apl5 carries a C‐terminal mCherry and Pma1 a FKBP‐tag (Auffarth et al, 2014). Cells were grown in either the absence (control) or presence of 10 μM rapamycin, and localization of Vps41 and Apl5 was analyzed by fluorescence microscopy. Scale bar, 5 μm.
- Effect of clathrin deletion on the AP‐3 pathway. GFP‐tagged Nyv1 with a C‐terminal Snc1 transmembrane domain (GNS) was localized relative to FM4‐64-stained vacuoles in the indicated strains. Labeling of the cell surface by GFP indicates a defect in the AP‐3 pathway (Cabrera et al, 2009) Scale bar, 5 μm.
- Quantification of AP‐3 defect from (D). Linear intensity plots were laid over the cells, the AP‐3 defect was calculated by dividing GFP‐intensities on the vacuolar membrane by the sum of the intensity of vacuolar, and plasma membrane signal (n ≥ 30 cells). Bars show the mean vacuolar signal over total signal ± standard deviation.
