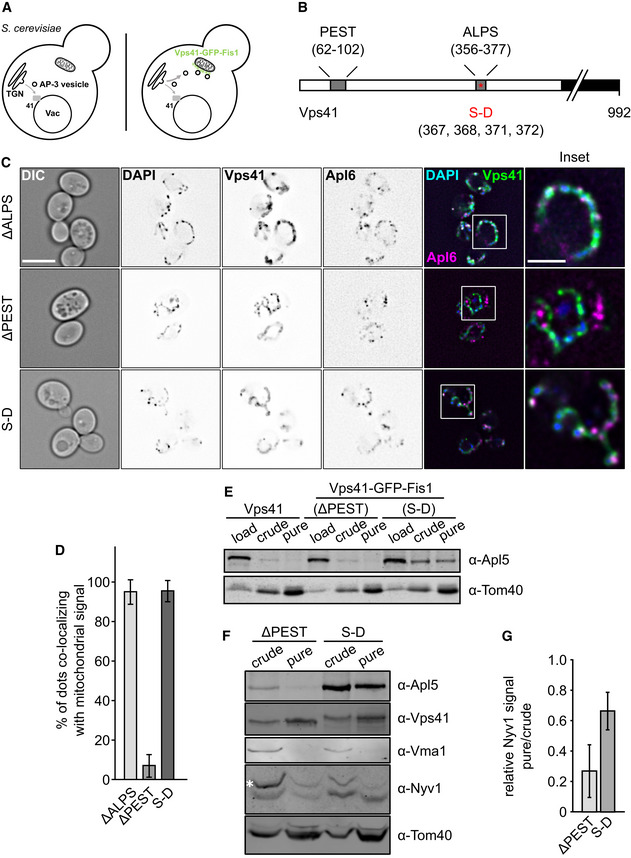
Figure 2. Mitochondrially anchored Vps41 can recruit AP‐3.

-
AModel of Vps41 re‐localization to mitochondria. In wild‐type cells, AP‐3 vesicles bud off the TGN and reach the vacuole where they are tethered by the HOPS subunit Vps41. Overexpressed Vps41, C‐terminally tagged with GFP‐Fis1, localizes to the mitochondria where it is able to tether AP‐3 vesicles to the surface. A wild‐type copy of Vps41 is still present in the background to minimize disturbance in the endogenous system.
-
BScheme of the Vps41 primary sequence with indicated motifs. The Vps41 protein harbors two motifs in its N‐terminal region that have been shown to affect Apl5 binding, a PEST motif as well as an amphipathic lipid‐packaging sequence (ALPS) motif (Cabrera et al, 2010). Furthermore, phosphorylation sites at residues S367, S368, S371, and S372 are shown, which are mutated in a phosphomimetic mutant (SD).
-
CTethering of AP‐3 vesicles to the mitochondrial surface. Cells were grown at 30°C in YPG and kept in logarithmic phase. Just prior to imaging, the mitochondrial DNA was stained with DAPI as described in the methods. Localization of Apl6 and Vps41 was analyzed by fluorescence microscopy. First column shows DIC (difference interference contrast) image of cells. Scale bar, 5 μm. The inset shows the indicated magnification. Scale bar in inset, 2 μm.
-
DQuantification of (C). Apl5 dots co‐localizing with GFP signal were counted and plotted in percent of the total number of Apl5 dots. Bars show the mean percentage of co‐localization ± standard deviation (n ≥ 60 cells).
-
E, FPurification of mitochondria from selected strains. Mitochondria were purified from the indicated strains as described in the methods. The amount corresponding to 1% of the total volume was loaded as “load” sample, 5% were used for “crude” and “pure” mitochondria fractions. Samples were loaded on a 10% SDS‐PAGE gel and analyzed by Western blot. White asterisks indicate unspecific bands.
-
GQuantification of relative Nyv1 signal intensity from (F). Signal intensity was determined using ImageJ and a ratio of pure over crude signal intensity normalized to Tom40 signal intensity was plotted. Bars show the relative Nvy1 signal intensity ± standard deviation from n = 3 independent experiments.
