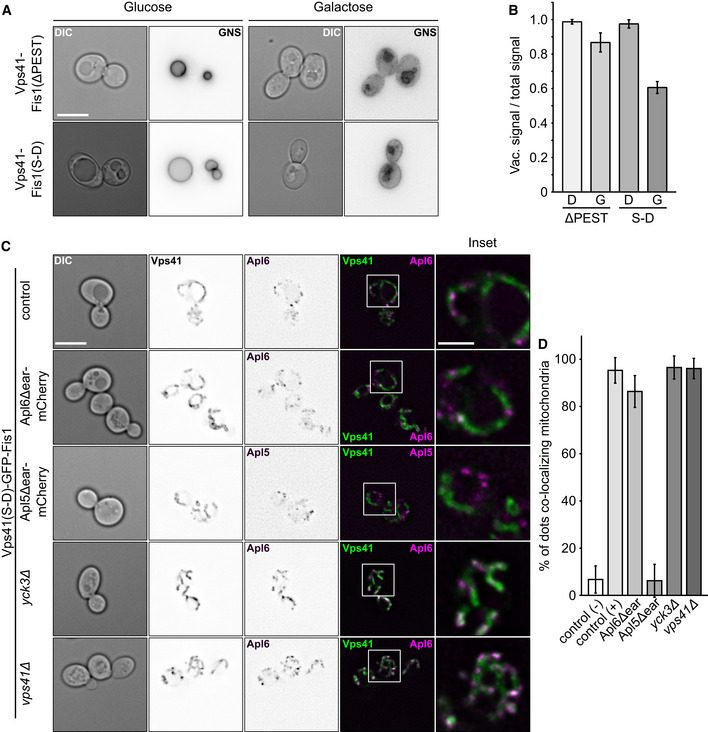
Figure 4. Effect of mistargeting Vps41 on the AP‐3 pathway.

- GNS was localized by fluorescence microscopy in the indicated strains grown in medium containing glucose or galactose (see Fig 1D). Images were inverted to visualize possible defects. First column shows DIC image of cells. Scale bar, 5 μm.
- Quantification of the AP‐3 defect from (A). Linear intensity plots were laid over cells grown in medium containing glucose (D) or galactose (G), the AP‐3 defect was calculated by dividing GFP‐intensities on the vacuolar membrane by the sum of the intensity of vacuolar, and plasma membrane signal (n ≥ 15 cells). Bars show the mean vacuolar signal over total signal ± standard deviation.
- Effect of different truncations and deletions on AP‐3 targeting to mitochondria. Indicated strains were grown at 30°C in YPG and kept in logarithmic phase. Localization of Apl5 or Apl6 and Vps41 was analyzed by fluorescence microscopy. First column shows DIC image of cells. Scale bar, 5 μm. Scale bar in inset, 2 μm.
- Quantification of (C). (−) Control corresponds to Vps41(ΔPEST)‐GFP-Fis1 Apl6‐mCherry (CUY12558) and (+) corresponds to Vps41(S‐D)-GFP‐Fis1 Apl6‐mCherry (CUY12560). Apl5‐/Apl6‐dots co‐localizing with GFP signal were counted and plotted in percent of the total number of Apl5‐/Apl6‐dots (n ≥ 63). Bars show the mean percentage of co‐localization ± standard deviation.
