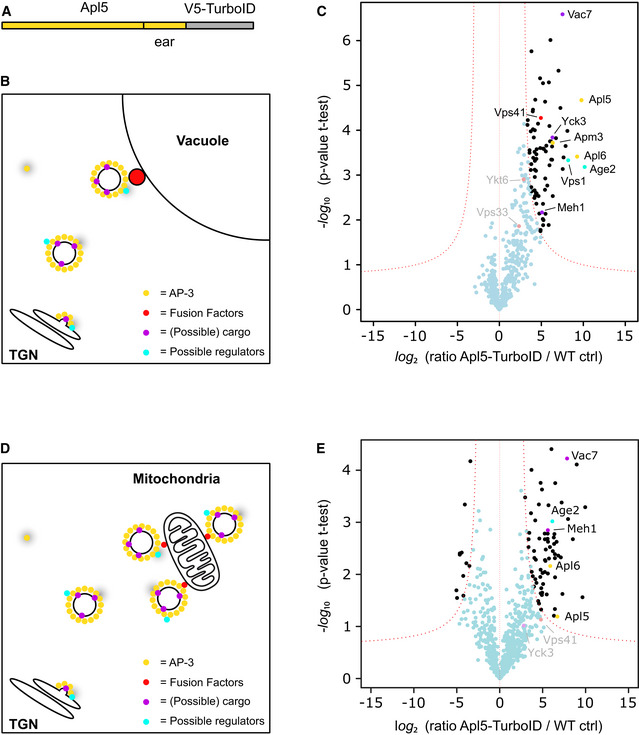
Figure 5. Analysis of AP‐3 interactors by proximity labeling.

- Scheme of Apl5 with C‐terminal TurboID tag.
- Model of possible biotinylation events along the AP‐3 pathway. AP‐3 has to be recruited to the TGN where it concentrates cargo and forms a vesicle. This is transported to the vacuole where it is tethered and subsequently undergoes fusion. During these steps, several interactors can come in close proximity to the TurboID Biotin Ligase (gray shade).
- Volcano plots of proteins in close proximity to Apl5‐TurboID versus control cells, from a label‐free proteomics analysis of streptavidin‐biotin pulldowns. The logarithmic ratios of protein intensities are plotted against negative logarithmic P values of two‐tailed Student's t‐test, equal variance, performed from n = 3 independent experiments. The red dashed line (significance, 0.05) separates specifically identified proteins (top right portion of plot) from background. Selected top hits are indicated with black dots, and all specific interactors are reported in Dataset EV1. Named hits are marked with color according to legend in (B). Gray text indicates selected non‐significant hits.
- Model of possible biotinylation events with AP‐3 vesicles tethered to the mitochondrial surface by mitochondrially targeted Vps41.
- Volcano plots of proteins in close proximity to Apl5‐TurboID versus control cells in a GAL1pr‐Vps41‐GFP-Fis1 background, from a label‐free proteomics analysis of streptavidin‐biotin pulldowns with cells grown in YPG. The logarithmic ratios of protein intensities are plotted against negative logarithmic P values of two‐tailed Student's t‐test, equal variance, performed from n = 3 independent experiments. The red dashed line (significance, 0.001) separates specifically identified proteins (top right portion of plot) from background. Selected top hits are indicated with black dots, and all specific interactors are reported in Dataset EV2. Named hits are marked with color according to legend in (B). Gray text indicates selected non‐significant hits.
