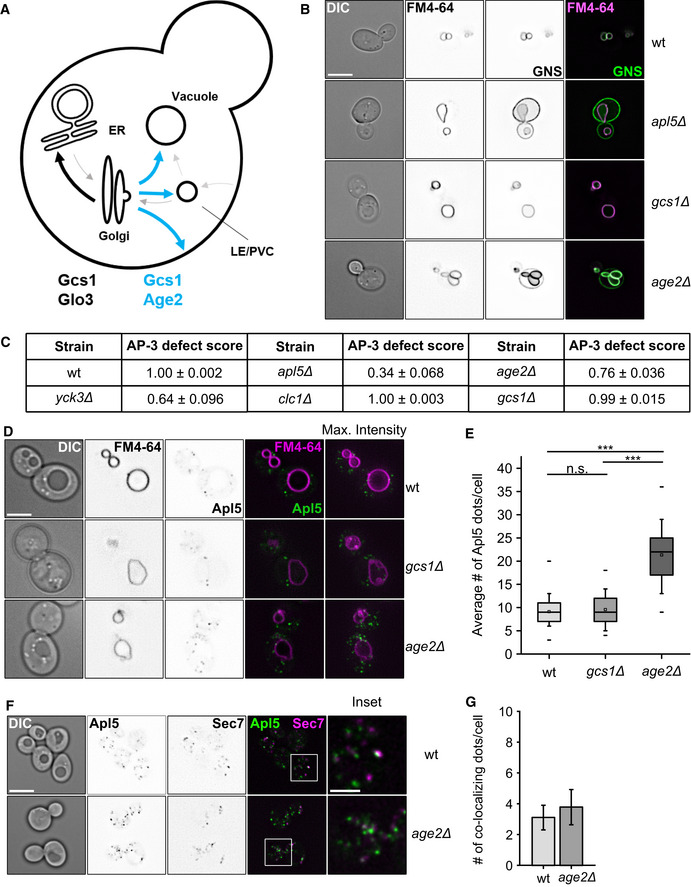
Figure 6. Effect of ArfGAP deletions on the AP‐3 pathway.

- Model of ArfGAP function in vesicle trafficking through the Golgi in yeast. Gcs1 and Glo3 function in trafficking from the cis‐Golgi to the ER, whereas Age2 and Gcs1 may function at or beyond the TGN (see text).
- AP‐3 sorting defects in GAP deletions. The AP‐3 reporter GNS (see Fig 1D) was localized relative to FM4‐64 stained vacuoles in the indicated strains. First column shows the DIC image of cells. Scale bar, 5 μm.
- Table summarizing AP‐3 trafficking defects in selected mutants.
- Localization of AP‐3 in ArfGAP deletion strains. Localization of C‐terminally GFP‐tagged Apl5 relative to FM4‐64 stained vacuoles in the indicated strains. First column shows DIC image of cells. Scale bar, 5 μm.
- Quantification of Apl5‐dots in (D). Apl5‐positive dots were counted and averaged to the number of dots per cell. Box boundaries indicate 25 and 75% of the dataset. The middle line indicates the median and the small square the mean. Whiskers correspond to 5 and 95% values, whereas the small lines show the farthermost outliers (n ≥ 110 cells). Significance was determined with a two‐tailed t‐test (***P ≤ 0.001).
- Co‐localization of C‐terminally GFP‐tagged Apl5 and C‐terminally mCherry‐tagged Sec7 in wt and age2Δ background. Cells were grown at 30°C and kept in logarithmic phase. Scale bar, 5 μm. Scale bar in inset, 2 μm.
- Quantification of co‐localization from (F) normalized per cell. Number of co‐localizing dots was determined and normalized to the number of co‐localization events per cell. Bars show the mean number of co‐localizing dots per cell ± standard deviation (n ≥ 60).
