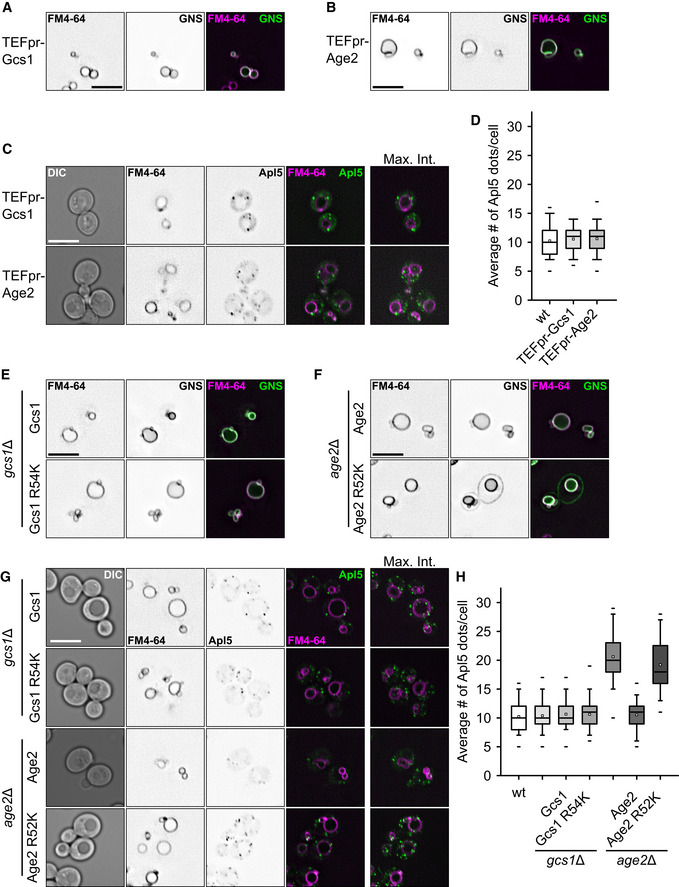
Figure 7. Requirement of Age2 ArfGAP activity in AP‐3 trafficking.

-
A, BAP‐3 sorting defects in strains overexpressing Gcs1 (A) or Age2 (B). The AP‐3 reporter GNS (see Fig 1D) was localized relative to FM4‐64 stained vacuoles in the indicated strains. Scale bar, 5 μm.
-
CLocalization of AP‐3 in ArfGAP overexpression strains. Localization of C‐terminally GFP‐tagged Apl5 relative to FM4‐64 stained vacuoles in the indicated strains. Scale bar, 5 μm.
-
DQuantification of Apl5 dots in (C). Apl5‐positive dots were counted and averaged to the number of dots per cell. Box boundaries indicate 25 and 75% of the dataset. The middle line indicates the median and the small square the mean. Whiskers correspond to 5 and 95% values, whereas the small lines show the farthermost outliers (n ≥ 80 cells).
-
E, FAP‐3 sorting defects in GAP‐dead mutants of Gcs1 (E) and Age2 (F). The AP‐3 reporter GNS (see Fig 1D) was localized relative to FM4‐64 stained vacuoles in the indicated strains. Scale bar, 5 μm.
-
GLocalization of AP‐3 in GAP‐dead mutants of Gcs1 and Age2. Localization of C‐terminally GFP‐tagged Apl5 relative to FM4‐64-stained vacuoles in the indicated strains. Scale bar, 5 μm.
-
HQuantification of Apl5 dots in (G). Apl5‐positive dots were counted and averaged to the number of dots per cell. Box boundaries indicate 25 and 75% of the dataset. The middle line indicates the median and the small square the mean. Whiskers correspond to 5 and 95% values, whereas the small lines show the farthermost outliers (n ≥ 80 cells).
