-
A
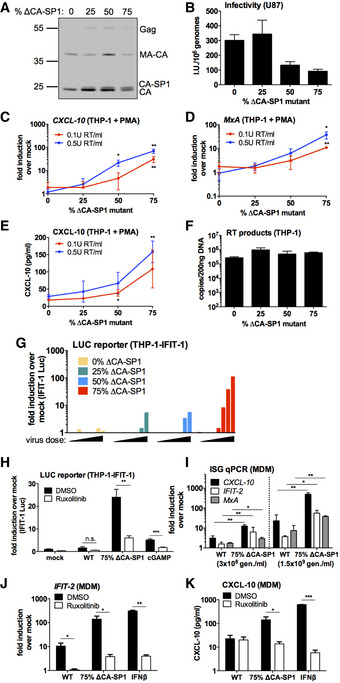
Immunoblot of HIV‐1 GFP virus particles (2 × 10¹¹ genomes) with varying proportions of ΔCA‐SP1 protease cleavage mutation detecting p24.
-
B
Titration of HIV‐1 GFP ΔCA‐SP1 viruses on U87 cells. Mean ± SD, n = 3.
-
C, D
ISG qRT‐PCR from PMA‐treated THP‐1 shSAMHD1 cells transduced for 24 h with HIV‐1 GFP ΔCA‐SP1 viruses (0.1 U RT/ml red line, 0.5 U RT/ml blue line).
-
E
CXCL‐10 protein in supernatants from (C, D) (ELISA).
-
F
RT products from THP‐1 cells transduced for 24 h with 6 × 10⁹ genomes/ml (approx. 0.5 U RT/ml) HIV‐1 GFP ΔCA‐SP1 viruses.
-
G
IFIT‐1 reporter activity from monocytic THP‐1-IFIT‐1 cells transduced for 24 h with HIV‐1 GFP ΔCA‐SP1 viruses (0.016 – 0.2 U RT/ml). Data are shown as individual measurements, representative of 2 repeats.
-
H
IFIT‐1 reporter activity from monocytic THP‐1-IFIT‐1 cells transduced with HIV‐1 GFP containing either 0% (WT) or 75% ΔCA‐SP1 mutant, or stimulated with 4 μg/ml cGAMP as a control, in the presence of DMSO vehicle or 2 μM ruxolitinib.
-
I
ISG qRT‐PCR from primary MDM transduced for 24 h with WT HIV‐1 GFP or 75% ΔCA‐SP1 mutant (3 × 10⁸ genomes/ml or 1.5 × 10⁹ genomes/ml, equivalent to 0.1 U RT/ml and 0.5 U RT/ml).
-
J
ISG qRT‐PCR from primary MDM transduced for 24 h with WT HIV‐1 GFP or 75% ΔCA‐SP1 mutant (1.5 × 10⁹ genomes/ml), or stimulated with 1 ng/ml IFNβ, in the presence of DMSO vehicle or 2 μM ruxolitinib.
-
K
CXCL‐10 protein in supernatants from (J) (ELISA).
Data information: Data are mean ± SD,
n = 3, representative of 2 repeats (F, I‐K) or 3 repeats (C‐E, H). Statistical analyses were performed using the Student's
t‐test, with Welch's correction where appropriate and comparing to the 0% ΔCA‐SP1 virus (C–E, I) or the DMSO control (H, J, K). *
P <
0.05, **
P <
0.01, ***
P <
0.001. See also Fig
EV2.
Source data are available online for this figure.

