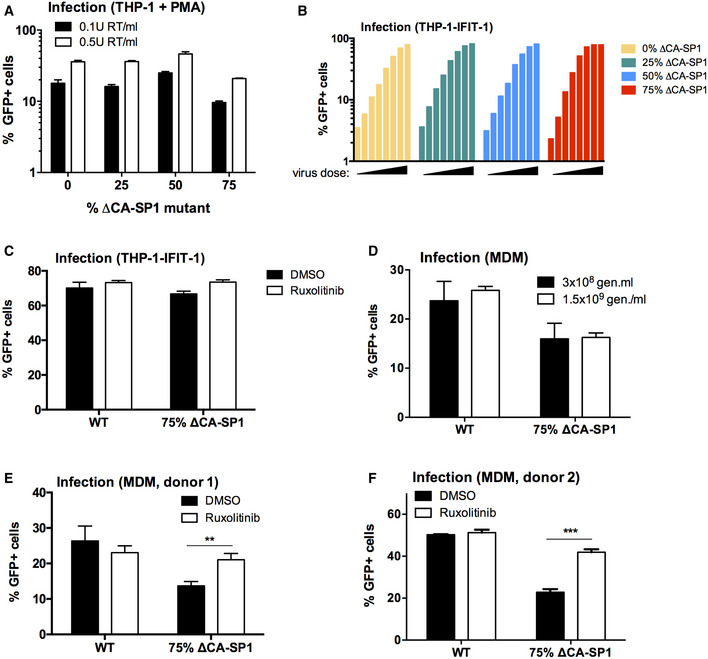
Infection levels of cells from Fig
2C–E. PMA‐treated THP‐1 shSAMHD1 cells transduced for 48 h with HIV‐1 GFP ΔCA‐SP1 viruses (0.1 U RT/ml or 0.5 U RT/ml).
Infection data from Fig
2G. THP-1‐IFIT-1 cells transduced for 48 h with HIV‐1 GFP ΔCA‐SP1 viruses (0.016–0.2 U RT/ml).
Infection data from Fig
2H. THP-1‐IFIT-1 cells transduced for 48 h with HIV‐1 GFP containing either 0% (WT) or 75% ΔCA‐SP1 mutant in the presence of DMSO vehicle or 2 μM ruxolitinib.
Infection data from Fig
2I. Primary MDM transduced for 48 h with WT HIV‐1 GFP or 75% ΔCA‐SP1 mutant (3 × 10
8 genomes/ml or 1.5 × 10
9 genomes/ml).
Infection data from Fig
2J and K. Primary MDM transduced for 48 h with WT HIV‐1 GFP or 75% ΔCA‐SP1 mutant (1.5 × 10
9 genomes/ml) in the presence of DMSO vehicle or 2 μM ruxolitinib.
Repeat of (E) in a second donor.
Data information: Data are individual measurements (B) or mean ± SD,
n = 3 (A, C–F), representative of 2 repeats. Statistical analyses were performed using Student's
t‐test, with Welch's correction where appropriate and comparing to the DMSO control. **
P <
0.01, ***
P <
0.001.

