
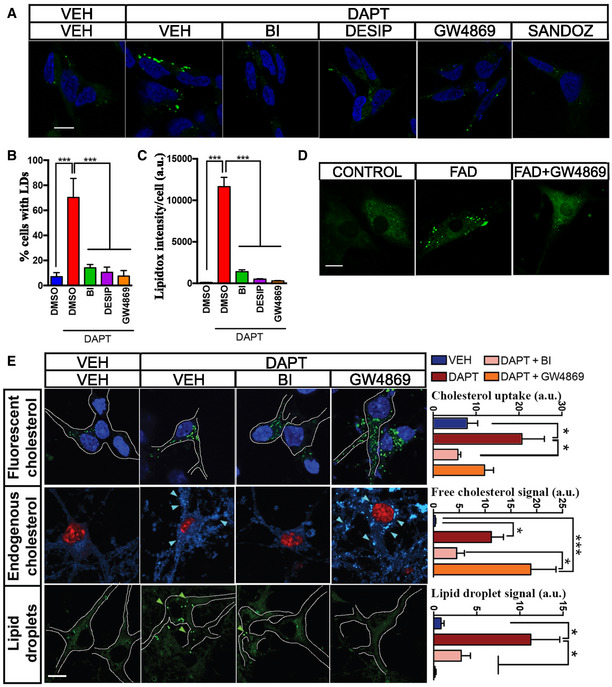
Figure EV3. Upregulation of cholesterol uptake induced by elevated C99 results in the activation of sphingomyelinase activity.
-
AConfocal images of human neuroblastoma cells (SH‐5YSY) incubated with the indicated treatments for 12–16 h or DMSO (VEH) before staining with LipidTox to visualize lipid droplets (green). Treatment with Sandoz 58‐035, a specific ACAT1 inhibitor, caused a ˜95% reduction in cholesterol esterification. Nuclei are shown in blue (DAPI). Scale bar = 20 μm. One‐way ANOVA (n = 5; ***P < 0.001).
-
B, CGraphs showing (B) the percentage of cells containing lipid droplets (LDs) and (C) the quantification of fluorescent intensity/cell (ImageJ). Note how elevations in cholesterol esterification can be induced by DAPT and rescued by incubation with either 100 nM BACE inhibitor (BI) or the SMase inhibitors, desipramine (DESIP, 10 μM), or GW4869 (5 μM). For Lipidtox intensity/cell. One‐way ANOVA (n = 5; ***P < 0.001).
-
DConfocal images of control and FAD fibroblasts incubated with SMase inhibitor, GW4869, for 12–16 h and stained with LipidTox to detect lipid droplet formation. Scale bar = 20 μm.
-
ERepresentative confocal images of cortical neurons from WT mice, incubated with the indicated inhibitors. Cholesterol uptake was assessed by internalization of fluorescent cholesterol analog (NBD‐cholesterol 2 μM; upper panel, nuclei in blue); endogenous free cholesterol levels are shown by filipin staining (middle panel, nuclei in red); and cholesterol esterification and lipid droplet formation were revealed by LipidTox staining (lower panel). Arrows indicate the presence of filipin punctae or lipid droplets. Graphs on the right represent fluorescence intensity measured by ImageJ. Scale bar = 20 μm. a.u., arbitrary units. One‐way ANOVA with Greenhouse‐Geisser correction. (30–80 cells/condition from 3 independent experiments; post hoc, *P < 0.05, ***P < 0.001).
Source data are available online for this figure.