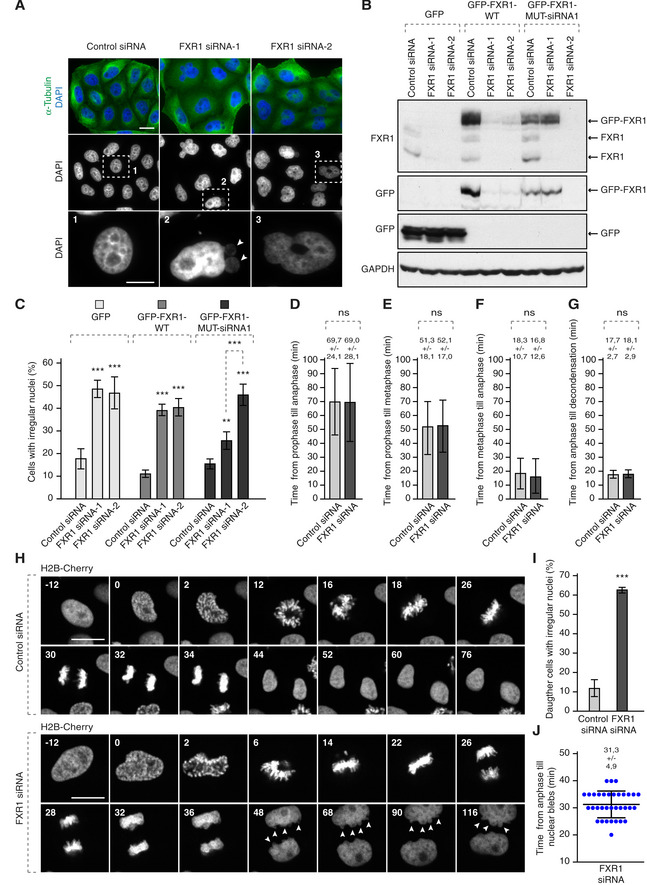
Figure 3. The FXR1 regulates nuclear morphology during G1 cell cycle phase.

-
AHeLa cells were treated with the indicated siRNAs, synchronized by double thymidine block, released for 24 h and analysed by immunofluorescence microscopy. The magnified framed regions are shown in the corresponding numbered panels. Arrowheads point to nuclear blebs observed in FXR1‐deficient cells.
-
B, CHeLa cells stably expressing GFP, GFP‐FXR1 wild type (WT) and GFP‐FXR1 mutated in the sequence recognized by FXR1 siRNA‐1 (GFP‐FXR1-MUT‐siRNA1) were treated with the indicated siRNAs, synchronized by double thymidine block, released for 24 h and analysed by Western blot (B) and immunofluorescence microscopy (C). The percentage of cells with irregular nuclei was quantified, and 1,000 cells were analysed (mean ± SD, **P < 0.01, ***P < 0.001; N = 3). The corresponding representative pictures are shown in Fig EV1.
-
D–JHeLa cells stably expressing the chromatin marker histone H2B labelled with mCherry were treated with indicated siRNAs, synchronized by double thymidine block, released for 12 h and analysed by immunofluorescence microscopy. Time from prophase till anaphase (D), from prophase till metaphase (E), from metaphase till anaphase (F) and from anaphase till chromatin decondensation (G) was quantified. The selected frames of the movies are depicted, and time is shown in minutes (H). Arrowheads point to nuclear blebs appearing during nuclear expansion of FXR1‐deficient cells. Percentage of daughter cells with irregular nuclei was quantified in (I), and time from anaphase till nuclear blebs was quantified in (J). Sixty‐six cells were analysed (mean ± SD, ***P < 0.001; N = 3).
