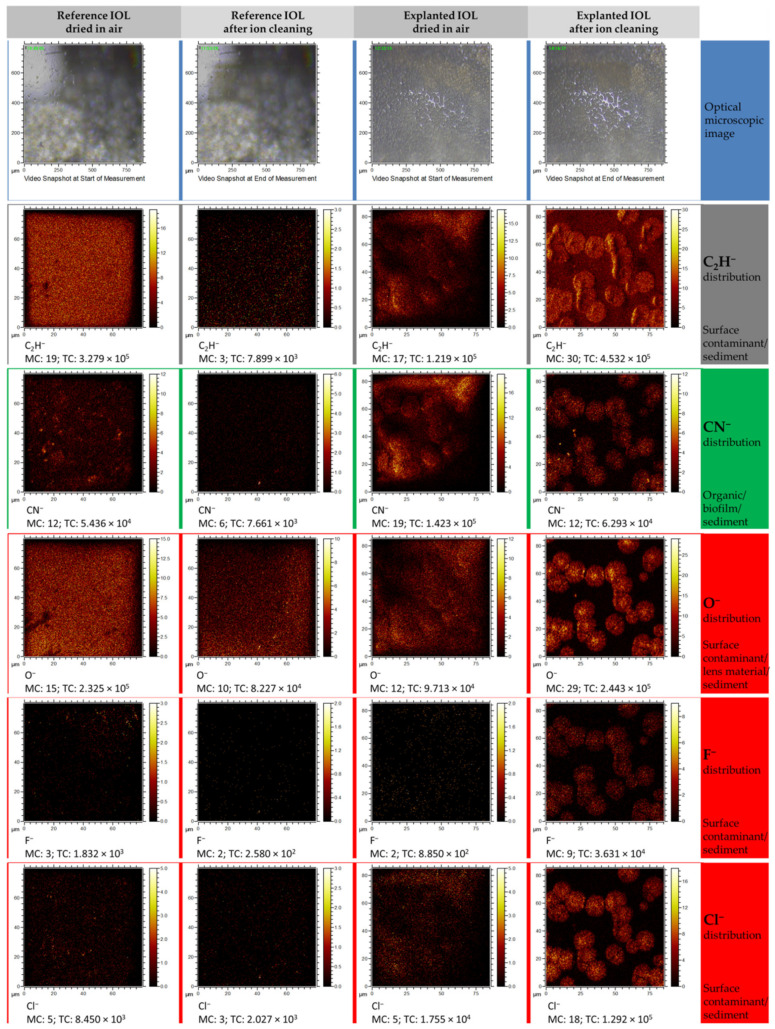
Figure 8.
TOF–SIMS distribution maps of selected elemental and molecular ions obtained from measurements in negative polarity. Each column represents a set of distribution maps of CN−, O−, F−, and Cl−. The first and second columns represent the ions’ distribution for the reference lens before and after the cleaning procedure, respectively, whereas the third and fourth columns show before and after cleaning of the explanted lens, respectively.

