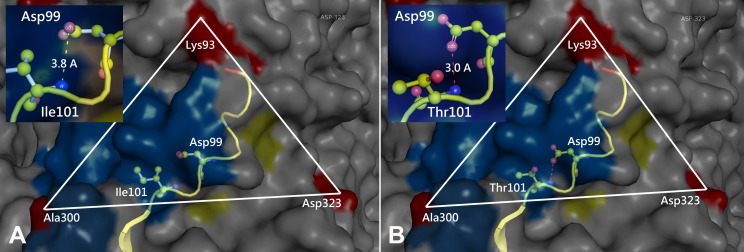
Figure 3. Comparison of the 3D structure of the transferrin receptor-binding site of the prototype FPV (A) and our isolate (B) capsid protein VP2.
Comparison of the 3D structure of the transferrin receptor-binding site of the prototype FPV (A) and our isolate (B) capsid protein VP2. Red residues represent the transferrin receptor-binding site. Triangle areas indicate the VP2 footprint for the transferrin receptor. Blue residues represent capsid protein binding to Fab fragments of neutralizing antibodies. Schematic diagram of amino acids interactions are shown in the upper left corner.

