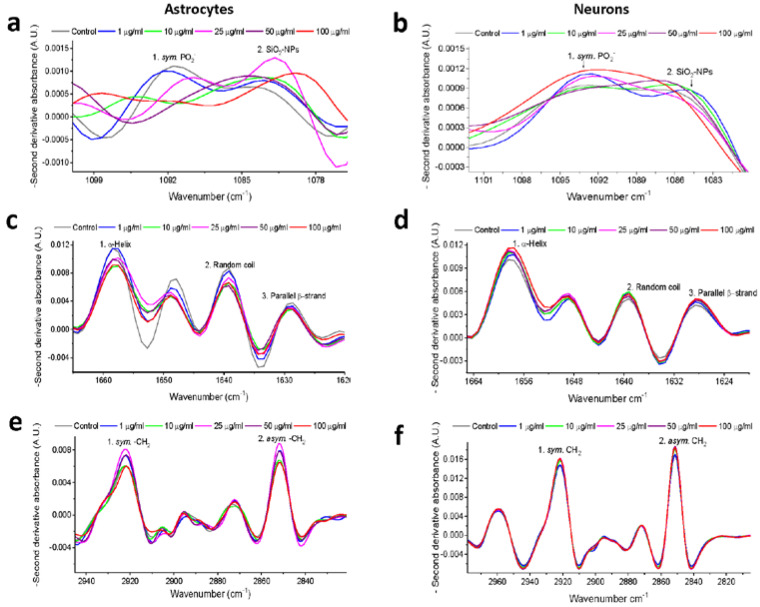
Figure 4.
Second derivative spectra analysis of nucleic acids, amide I and lipid regions after SiO2-NPs exposure. Nucleic acids correspond to symmetric PO2− at 1090 cm−1, and SiO2-NPs correspond to 1083 cm−1 spectral band in (a) astrocytes and (b) neurons. The secondary structure of proteins corresponds to the amide I region, which includes the 1627 cm−1 for parallel β-strand, 1639 cm−1 for random coil, and 1654 cm−1 for alpha-helix in (c) astrocytes and (d) neurons. Lipids correspond to 1852 cm−1 for symmetric -CH2 and 2923 cm−1 for asymmetric -CH2 in (e) astrocytes and (f) neurons.

