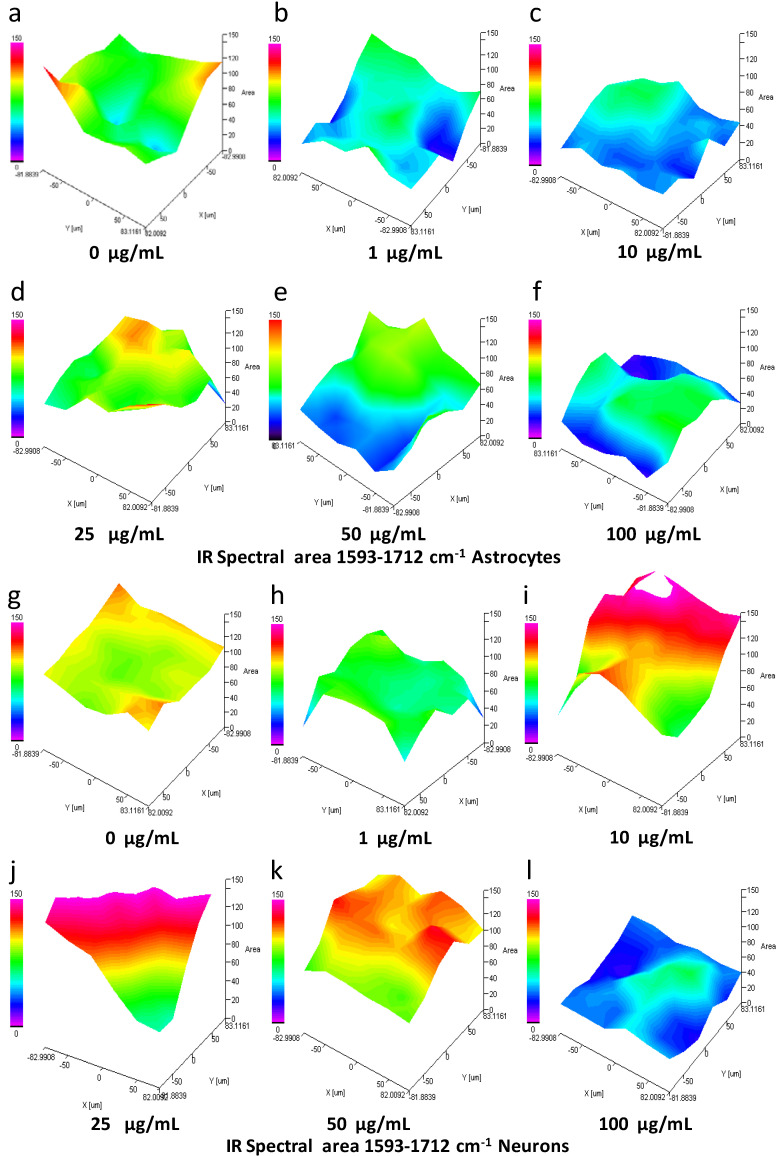
Figure 6.
Spectral area analysis by IQ mapping of 1593–1712 cm−1 region of astrocytes and neurons exposed to SiO2-NPs. The spectral region of 1593–1712 cm−1 that includes specific spectral bands related to secondary structures of proteins is presented for astrocytes (a–f) and neurons (g–l). A sample of cells treated with SiO2-NPs for 24 h was dispersed on a gold-coated slide. The three-dimensional image is presented in the x, y, and z axes, and the area presented as a gradient of color indicates a decrease (from blue) or increase (red) in the spectral signal. In astrocytes, a decrease in the signal seen as a blue area at 1 (b), 10 (c), 50 (e), and 100 (f) µg/mL SiO2-NPs is observed compared to control (a). No changes were observed at 25 µg/mL (d). In neurons, a strong increase in the signal (red area) was detected at 10 (i), 25 (k), and 50 (l) µg/mL. In contrast, at concentration of 1 (h) and 100 (l) µg/mL, spectral signal decrease (green and blue area) when compared to control (g). The image is representative of four independent experiments with three technical replicates.

