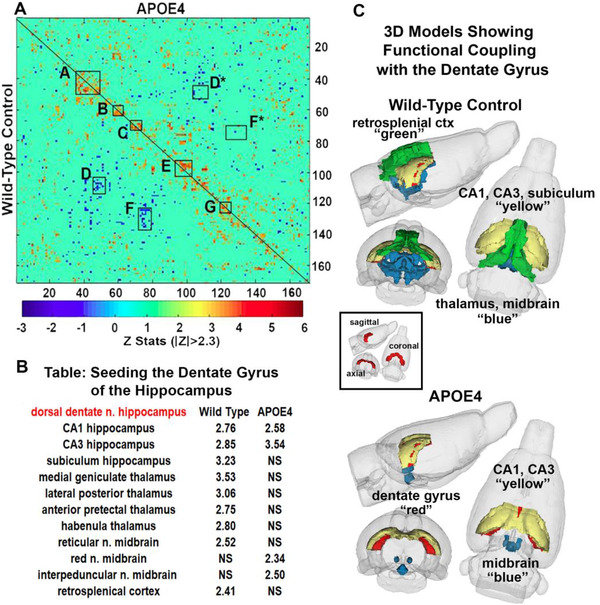
FIGURE 3.

Functional coupling to the hippocampus. Panel (A) shows a correlation matrix comparing the wilt‐type control with the apolipoprotein E (APOE)4 genotype. The table in panel (B) shows the brain areas functionally coupled to the dorsal dentate hippocampus and their accompanying Z values. NS, not significant. The 3D images in panel (C) are a reconstruction of the brain areas from the table for each genotype
