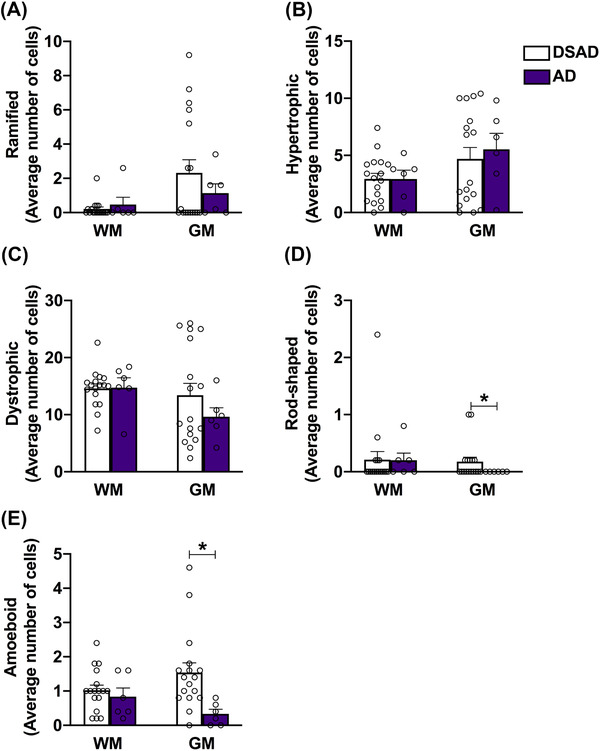
FIGURE 4.

Down syndrome with neuropathological Alzheimer's disease (DSAD) presents more rod‐shaped and amoeboid cells than AD. Differences in microglial counts for the white matter (WM) and gray matter (GM) between DSAD and AD groups are shown for (A) ramified, (B) hypertrophic, (C) dystrophic, (D) rod‐shaped, and (E) amoeboid phenotypes. While no significant changes were seen in the WM, the DSAD group presented significant increase in the number of rod‐shaped and amoeboid microglia cells in the GM, compared to AD alone. Data are presented as mean ± standard error of the mean, * P ≤ 0.05 (Student's t test)
