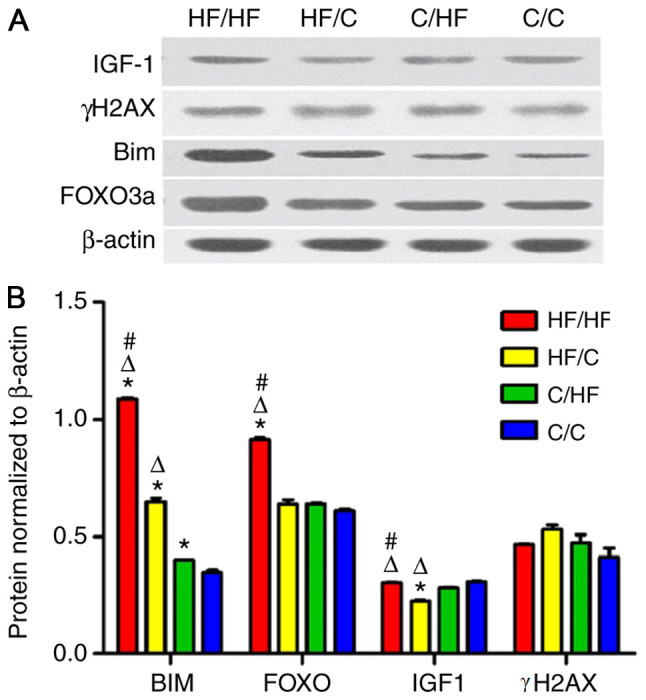
Figure 4.

The γH2AX, FOXO3a, Bim and IGF-1 protein expression level. (A) Western blot analyses were performed to determine protein levels. (B) The level of protein was normalized to β-actin levels. All values are reported as mean ± SEM. *P<0.01 vs. the C/C group; #P<0.01 vs. the HF/C group; ΔP<0.01 vs. the C/HF group (one-way ANOVA). FOXO3a, forkhead box protein O3a; IGF-1, insulin-like growth factor 1; γH2AX, phosphorylated form of H2AX histone variant; Bim, Bcl-2-like protein 11; HF, high fat; C, control.
