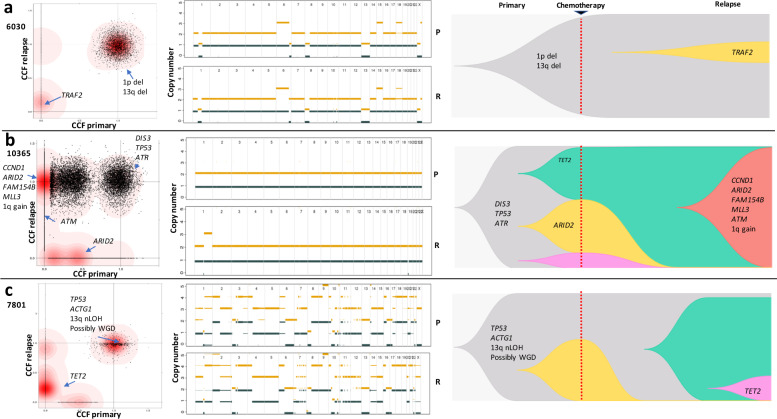
Fig. 3. Evolutionary trajectories of relapse.
a Pattern 1 (3/24), dominant clone in primary survives treatment and gains additional mutations at relapse; b Pattern 2 (4/24), subclone in primary survives treatment and expands to become dominant clone at relapse; c Pattern 3 (17/24), eradication or decrease in frequency of one or more clones in primary and emergence of new clones not previously detected in primary. Left panels, two-dimensional density plots showing clustering of mutations by cancer cell fraction (CCF) in primary and relapse tumours. Darker red areas indicate location of a high posterior probability of a cluster. Clusters are annotated with coding driver mutations and major copy number alterations. Pattern 1: no disappearance of primary clusters on the horizontal axis accompanied by appearance of new clusters on the vertical axis. Pattern 2: existence of cluster positioned on the vertical top and horizontal centre. Pattern 3: disappearance of clusters on the horizontal axis accompanied by appearance of clusters on the vertical axis. Central panels, chromosomal copy-number profiles of primary (upper) and relapse (lower) tumours. Thick and thin lines represent clonal and sub-clonal copy number states respectively. Yellow and dark blue lines denote total and minor copy number alleles. Right panels, Muller plots of evolutionary trajectories. P primary, R relapse. WGD Whole genome duplication.

