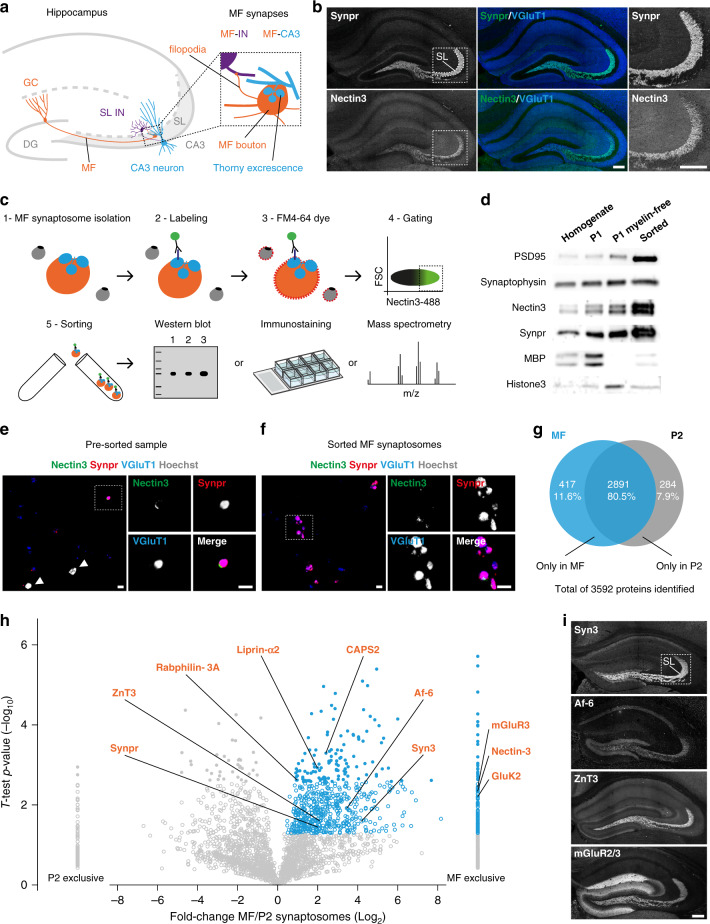
Fig. 1. Isolation and proteomic profiling of MF synaptosomes.
a Cartoon illustrating the hippocampal MF synapse. GC neurons, mossy fibers (MFs), MF bouton, and filopodia are in orange. CA3 pyramidal neuron and respective thorny excrescences are in blue. Stratum lucidum (SL) interneuron (IN) is in purple. DG dentate gyrus. b Confocal images of P28 mouse hippocampal sections immunostained for Synpr, Nectin3, and VGluT1. Magnified insets of the SL in CA3 are shown on the right. c Workflow to isolate and analyze MF synaptosomes. d Validation of enrichment for MF synaptosomes in sorted material by western blot. MPB, myelin-binding protein. e, f Confocal images of presorted and sorted material, respectively, immunostained for Nectin3, Synpr, VGluT1, and Hoechst. g Venn diagram capturing number and distribution of proteins identified in sorted MF synaptosomes and P2 synaptosomes by LC–MS/MS in three independent experiments (10–12 mice per experiment). h Relative distribution of proteins detected in sorted MF synaptosomes and P2 synaptosomes. Significant proteins with positive MF/P2 synaptosome log2 fold change are highlighted in blue (p value ≤ 0.05, two-sided Student’s t test). High-confidence measurements at a 5% FDR are shown as closed circles (q value ≤ 0.05, Benjamini–Hochberg correction). A selection of known MF synaptic proteins is annotated in orange. i Confocal images of P28 mouse hippocampal sections immunostained for known MF synaptic markers detected in sorted MF synaptosomes. Source data are provided as a Source data file. Scale bars in b and i 200 μm, in e and f 5 μm.

