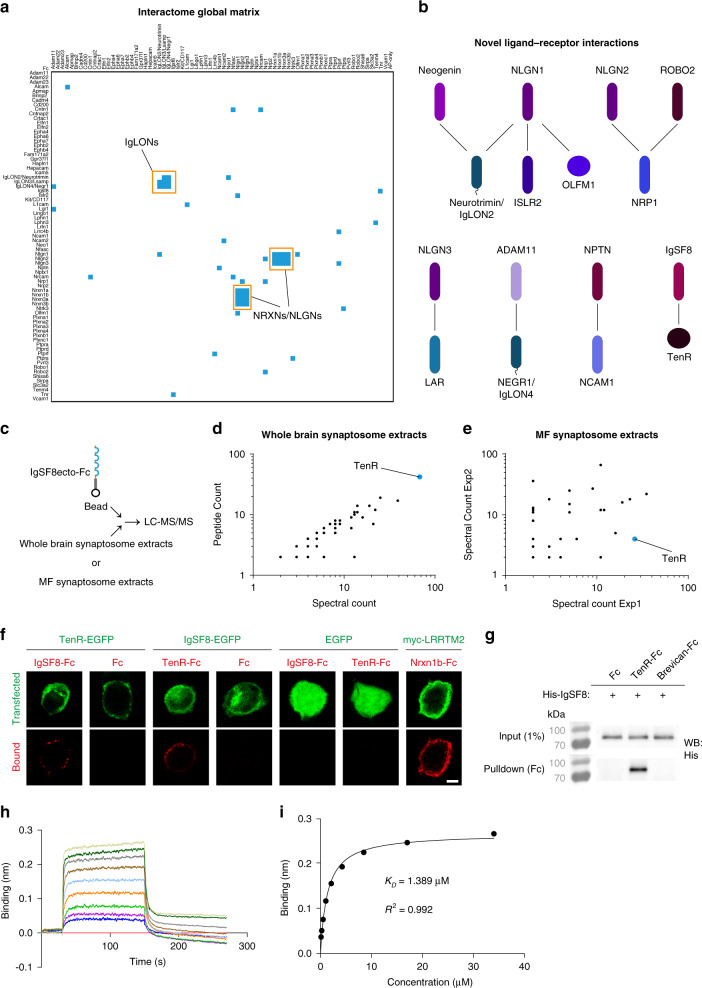
Fig. 3. MF synapse CSP interactome screening.
a Global matrix of data obtained from three independent experiments for interactions between 73 AP- and Fc-tagged proteins in both orientations (i.e., AP-X vs Fc-Y and AP-Y vs Fc-X), resulting in 73 × 73 = 5329 experimental points and 2701 unique pairwise interactions. Columns contain AP-fusion baits, including the AP-only construct as negative control, whereas rows contain Fc-fusion preys. Positive ligand–receptor interactions are indicated in blue. Two major modules of known ligand–receptor pairs are highlighted in orange: the NRXNs–NLGNs and the IgLON family. b Interaction networks of novel ligand–receptor pairs identified. Among these, the interaction between IgSF8 and TenR was the only one including a CSP of uncharacterized brain function. c Cartoon illustrating the Ecto-Fc MS workflow to validate IgSF8–TenR interaction in synaptosomes. d Graph of spectral and peptide counts of proteins captured in a pull-down experiment using whole rat brain synaptosome lysates. Only proteins which were absent in Fc controls and present with ≥2 spectral counts per IgSF8-ecto-Fc experiment are included. TenR is highlighted in blue. e Graph of spectral counts of proteins captured in two independent pull-down experiments using P21 mouse MF synaptosome lysates. Only proteins with ≤1 spectral counts in Fc controls and ≥2 spectral counts per IgSF8-ecto-Fc experiment are included. TenR is highlighted in blue. f Confocal images of cell-surface binding assays in transfected HEK293T cells show IgSF8–TenR interaction. Negative and positive controls used in the cell-surface binding assays are also shown. g Direct binding assays show direct and specific interaction of IgSF8 with TenR, but not with ECM protein Brevican. h Biolayer interferometry experiment of the IgSF8–TenR interaction. A concentration range of purified IgSF8 (34–0.133 µM) was used in twofold dilution plus buffer alone (red straight line). i Plotting the binding response (nm) vs IgSF8 concentration provided a measure of the affinity of the interaction (KD ~ 1.4 µM). Source data are provided as a Source data file. Scale bar in f 5 μm.

